iBwave Design Prediction Accuracy
by Vladan Jevremovic, PhD
and Ali Jemmali, PhD
Document Scope
iBwave Design’s RF Prediction module is based on the Fast Ray Tracing (FRT) algorithm. This algorithm is complemented by a calibration module, which allows for fine-tuning of propagation parameters, material penetration loss, and reflection coefficients. Comparing the module’s output with field measurements taken at various venues best validates the accuracy of the FRT prediction and calibration modules. To quantify the performance of the default, uncalibrated FRT algorithm, an indoor signal measurement campaign was conducted across North, Central, and South America. In total, 40 surveys were carried out at 8 frequency bands across 11 venues. This paper describes the venues, the measurement setup, the results, the differences between the predicted and measured coverage and discusses the accuracy of the prediction.

Measurement Setup & Venue Description
Monterrey Institute of Technology – Querétaro Campus (Mexico)
The Monterrey Institute of Technology and Higher Education, also known as Tecnológico de Monterrey, is a secular and coeducational private university based in Monterrey, Mexico. It’s grown to include 35 campuses throughout the country and is widely recognized as one of the most prestigious universities in Latin America. The Querétaro campus is in the center of the country, about 210 km north of Mexico City. The city is known for its cultural activities and historic buildings, which attract thousands of visitors every year from Mexico, Latin America, North America, Europe, and the East Asia. The campus also reflects this popularity, ranking among the top two campuses in the country regarding foreign student enrollment. A map of the campus is shown in Figure 1.
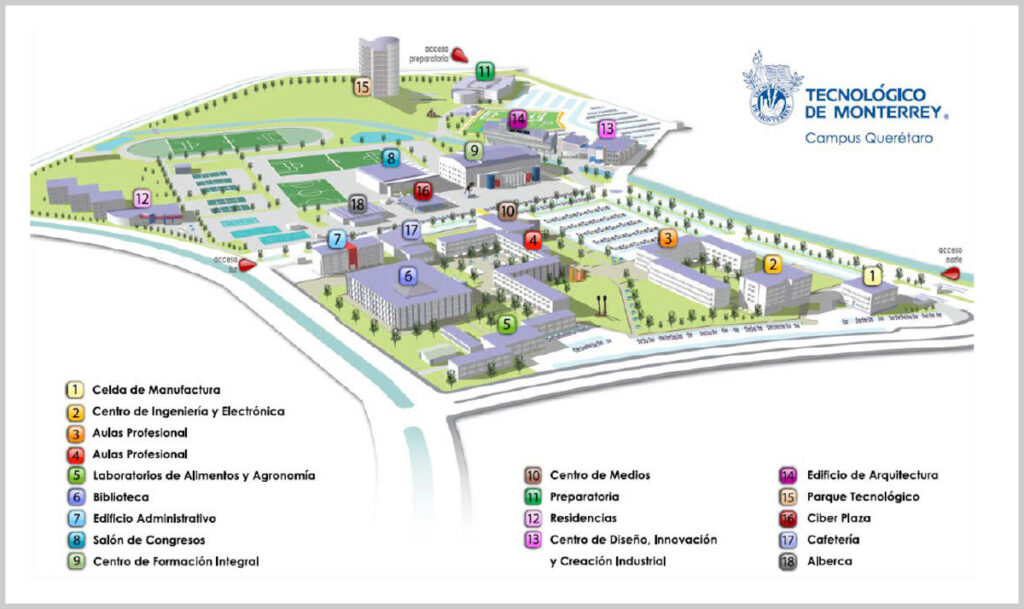
Monterrey Institute of Technology, Querétaro campus.
Continuous Wave (CW) surveys were conducted in the following buildings:
The following measurement equipment was used in all venues:
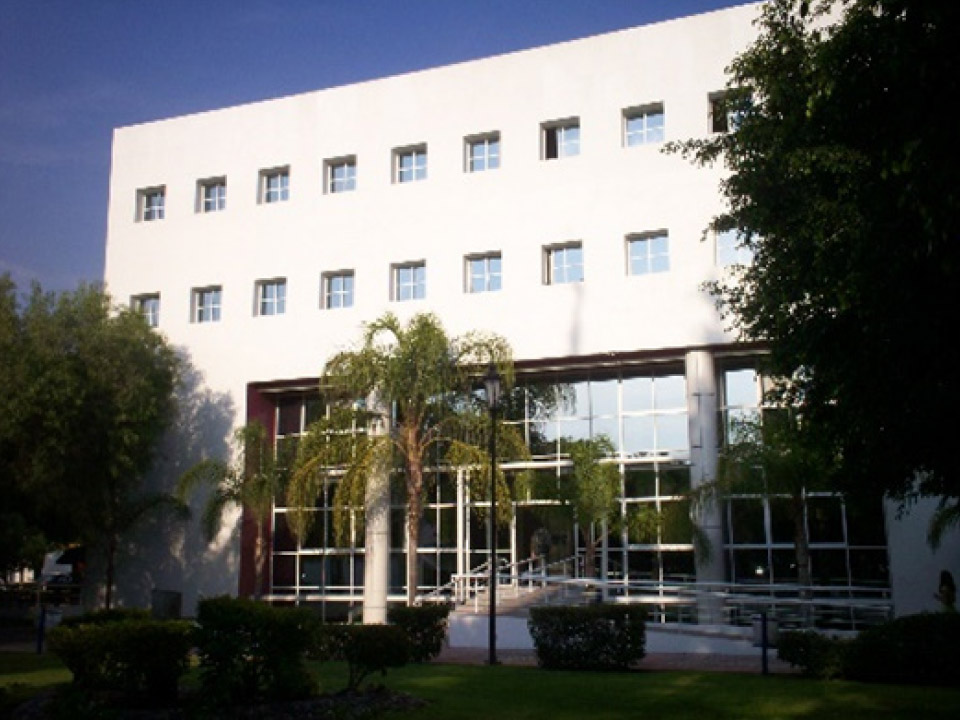
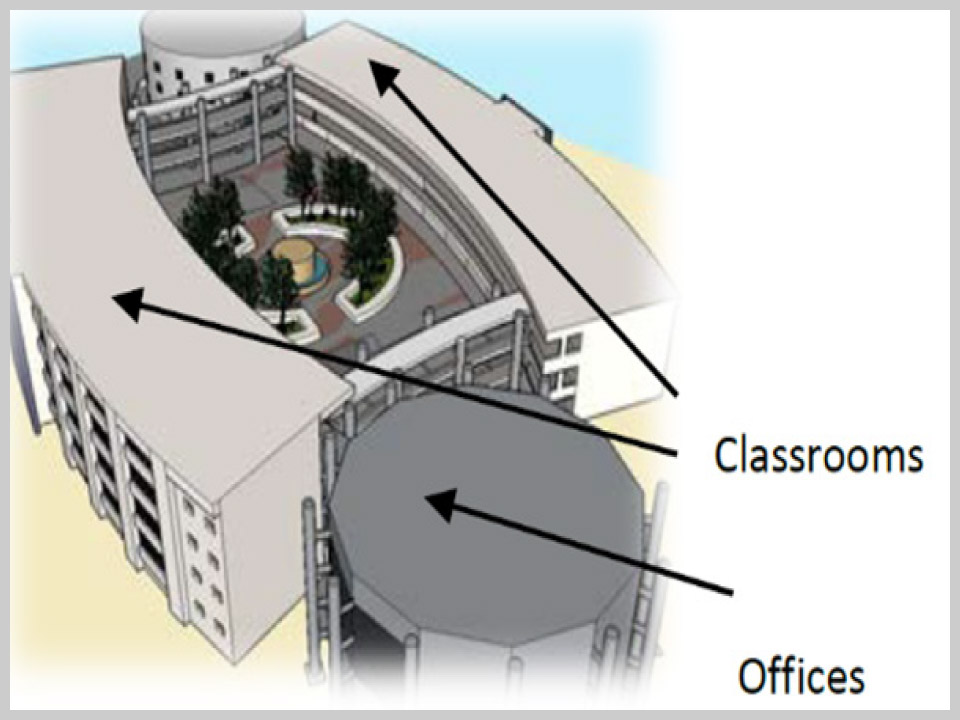
Building 2 – Engineering and Electronics Center
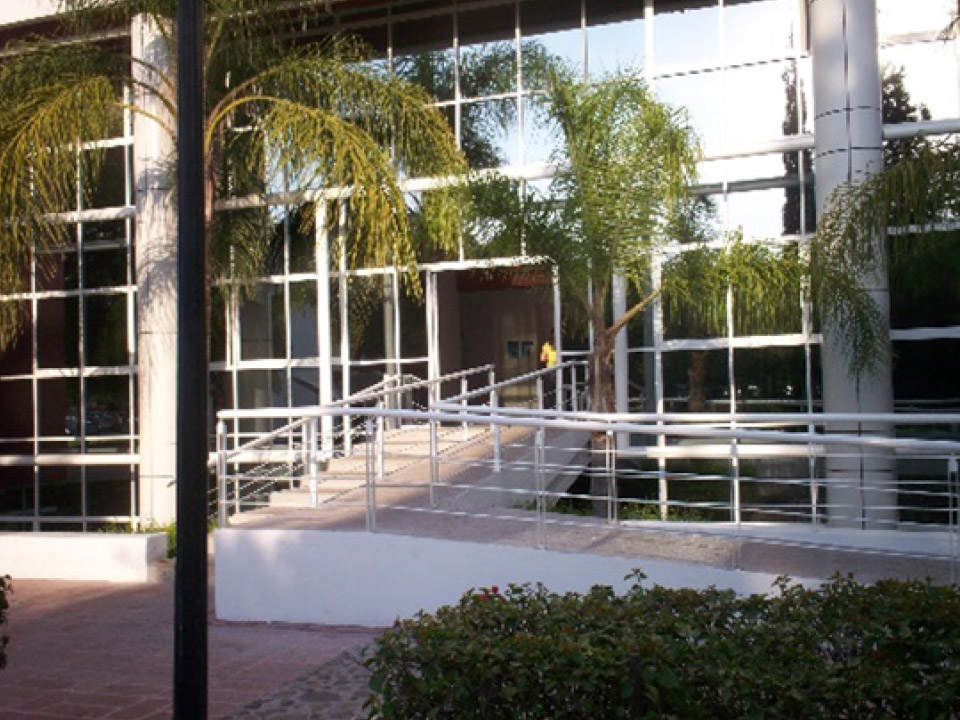
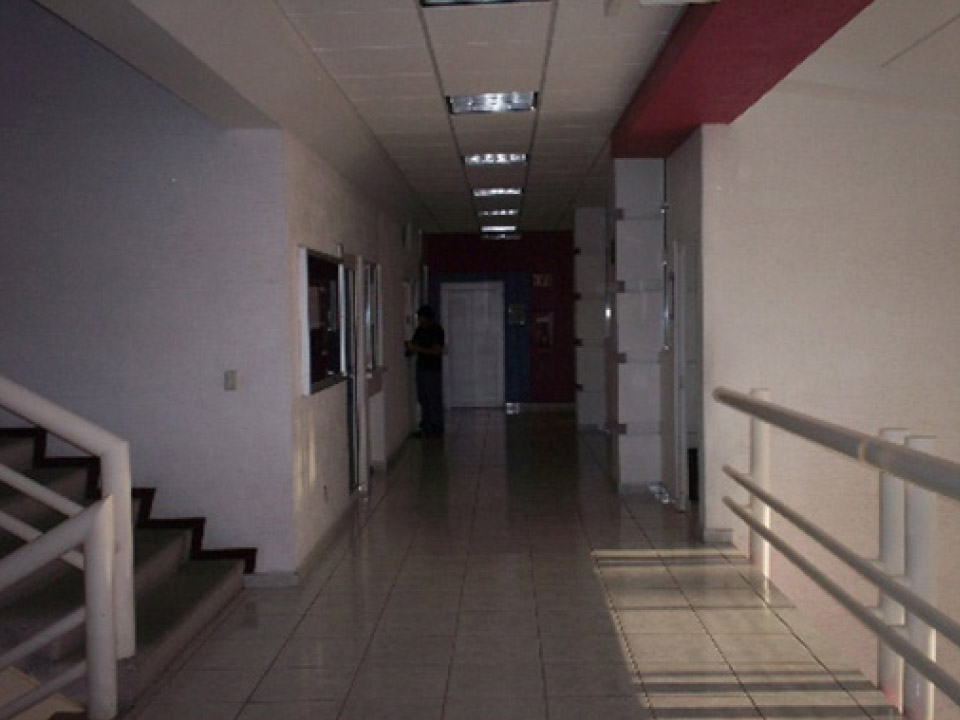
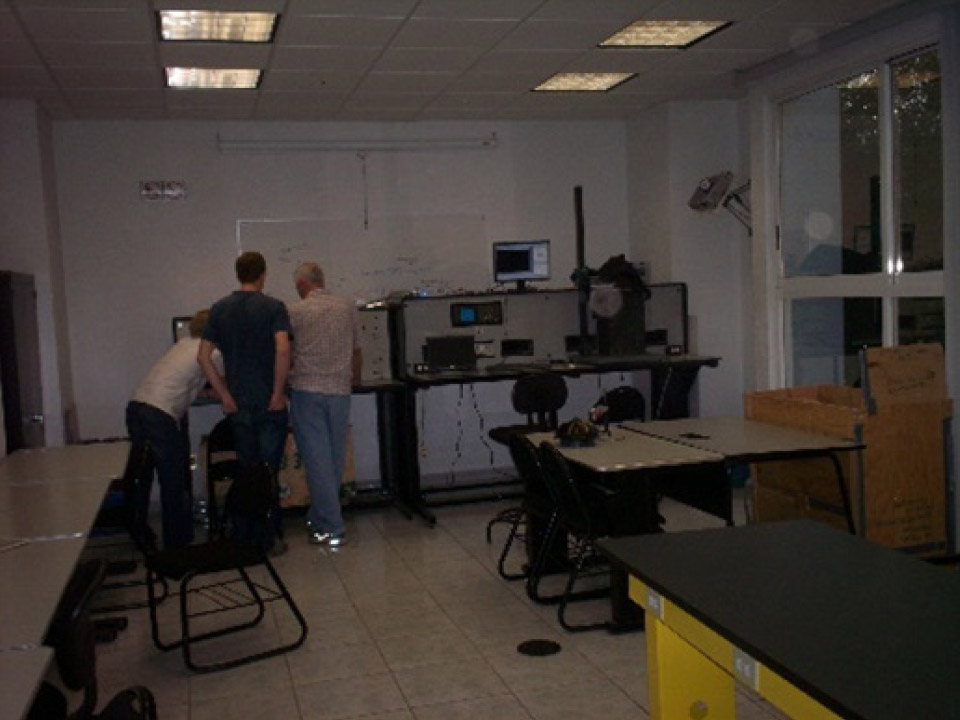
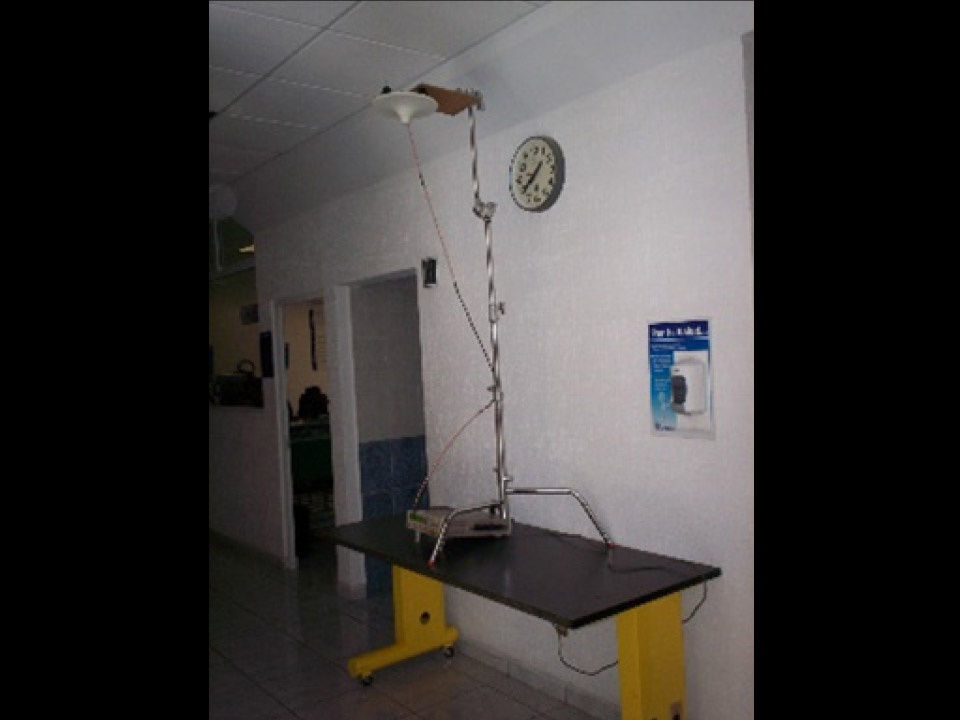
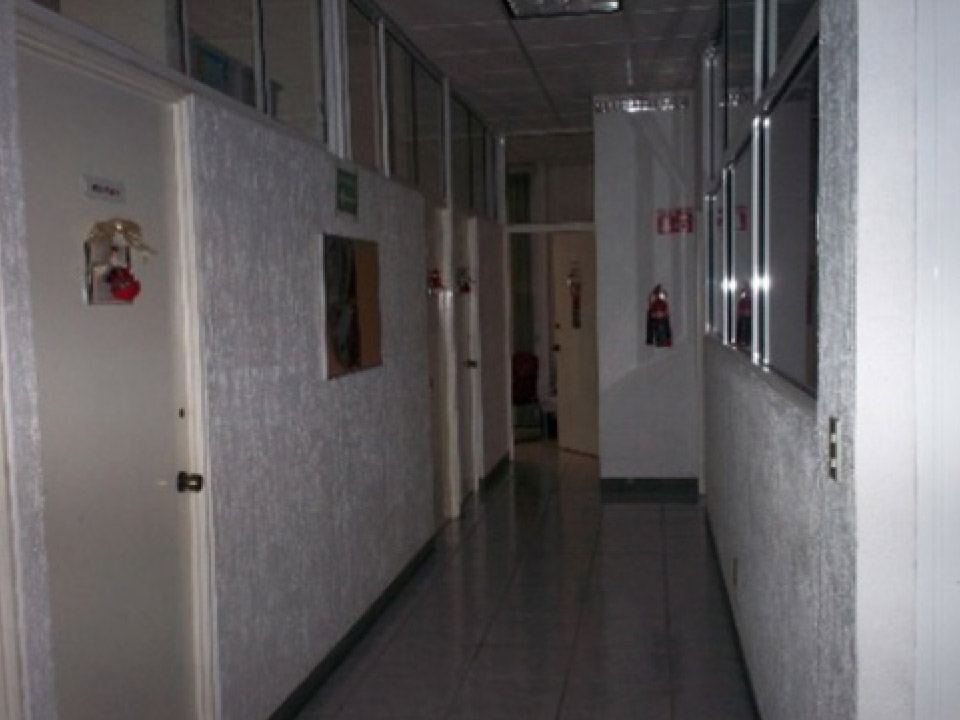
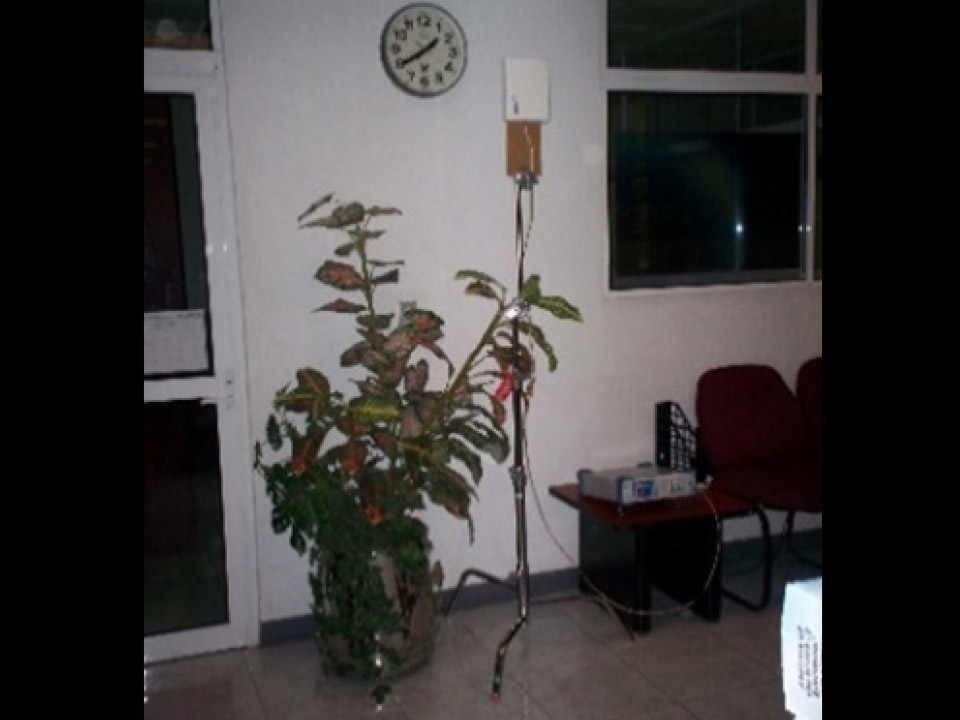
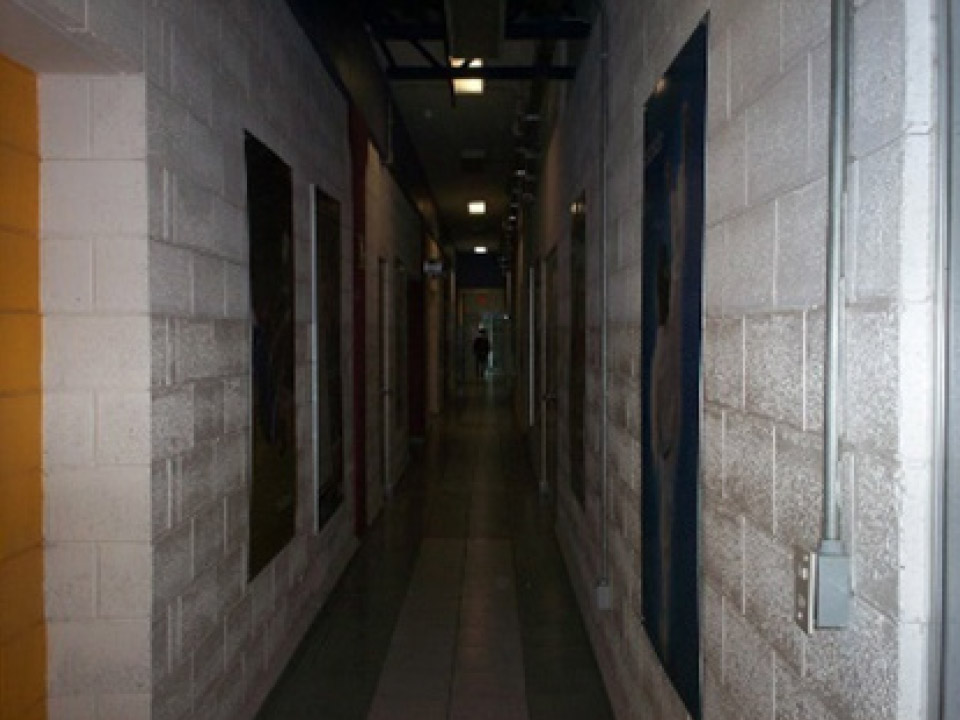
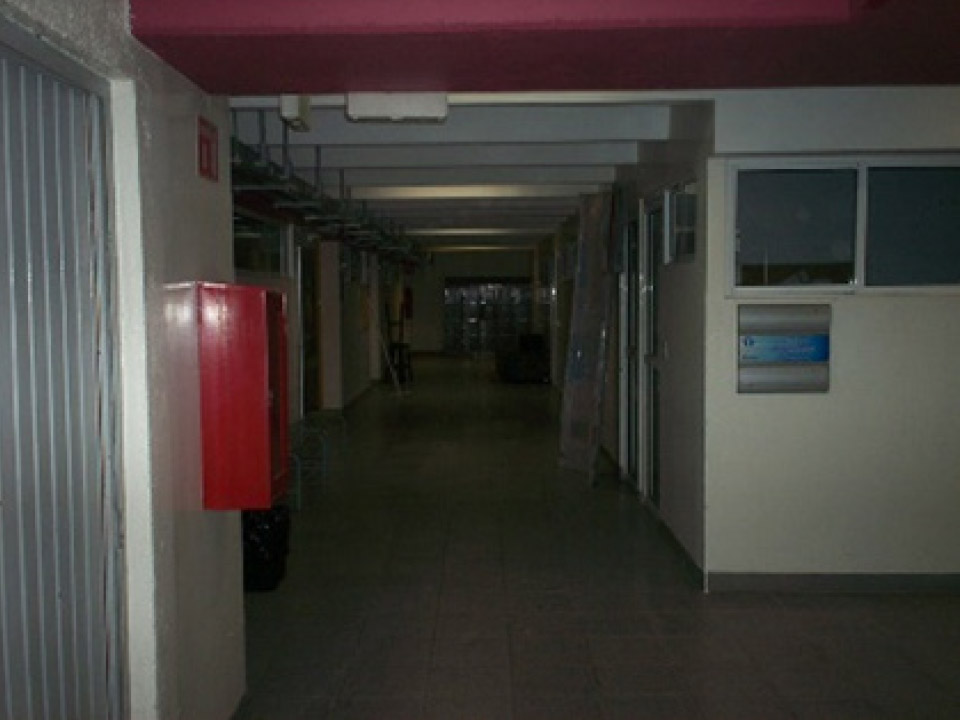
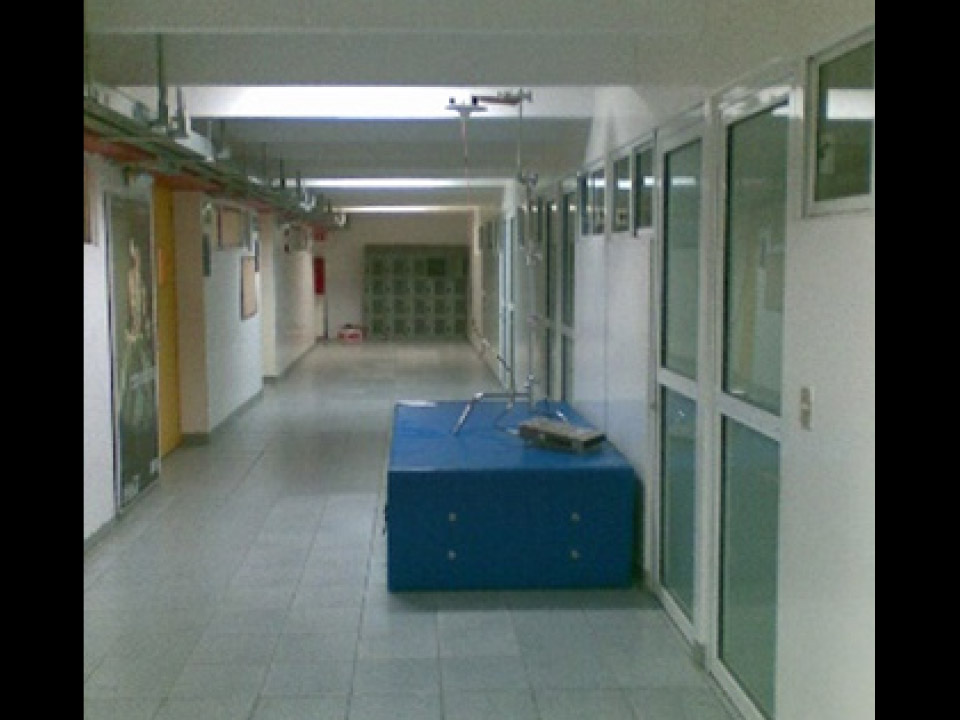
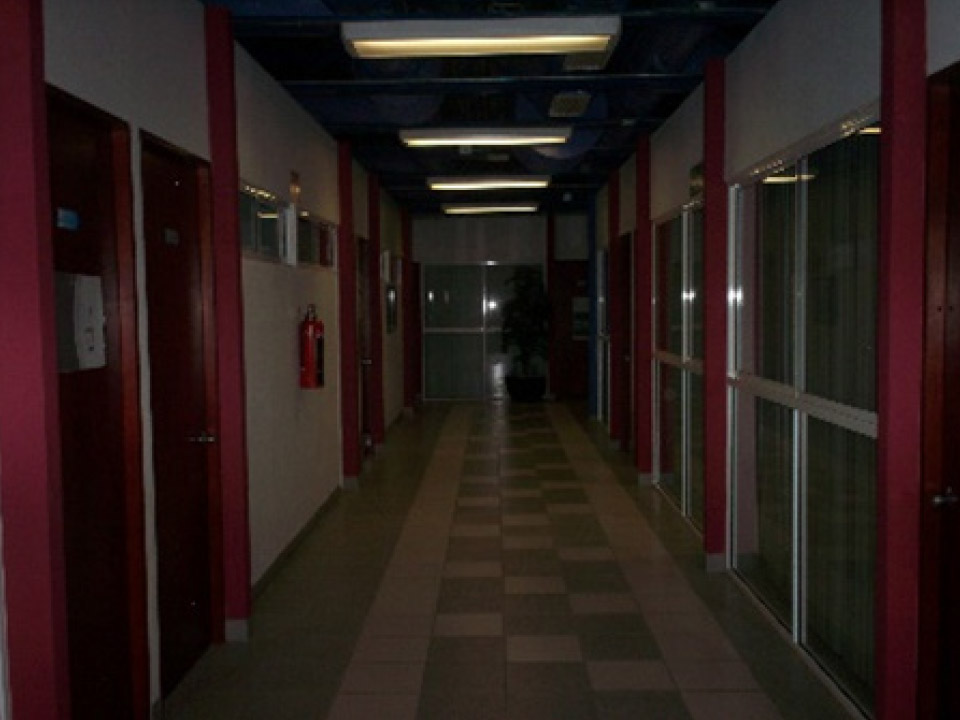
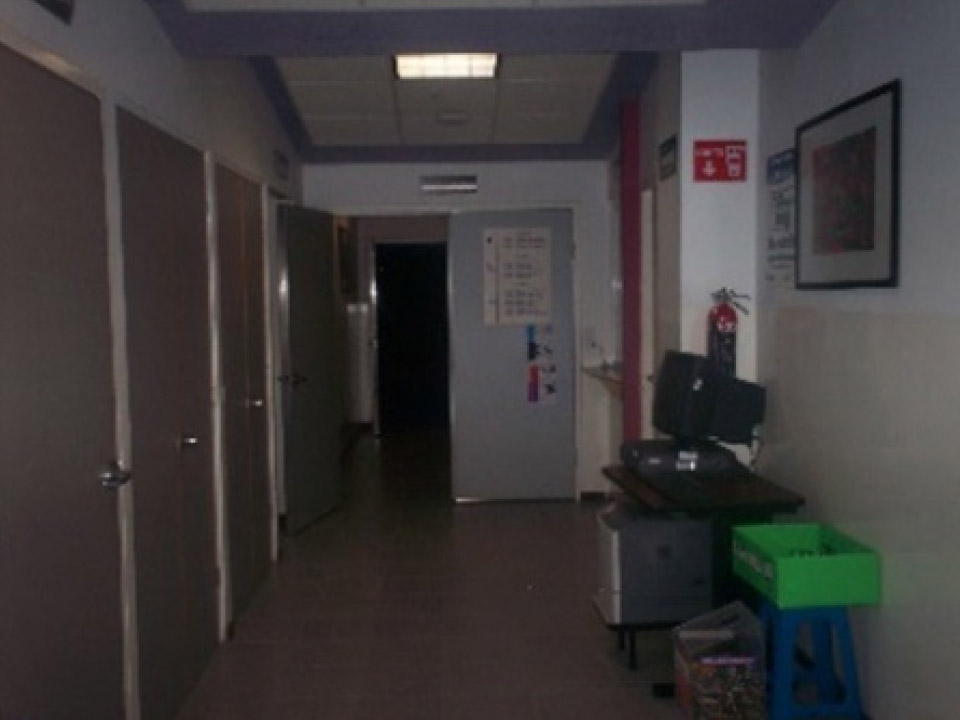
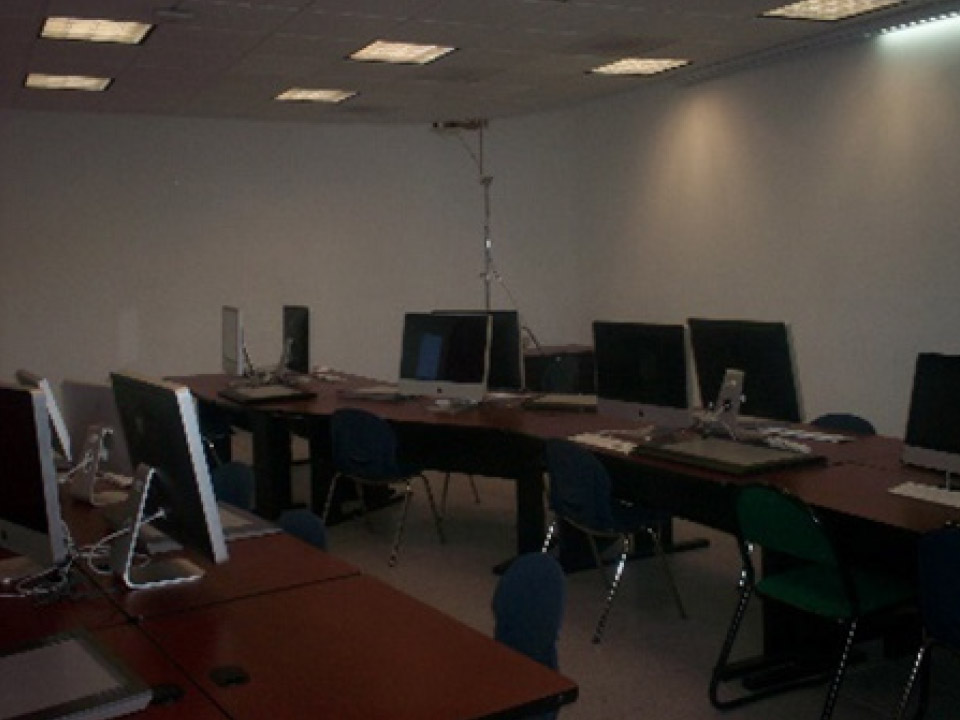
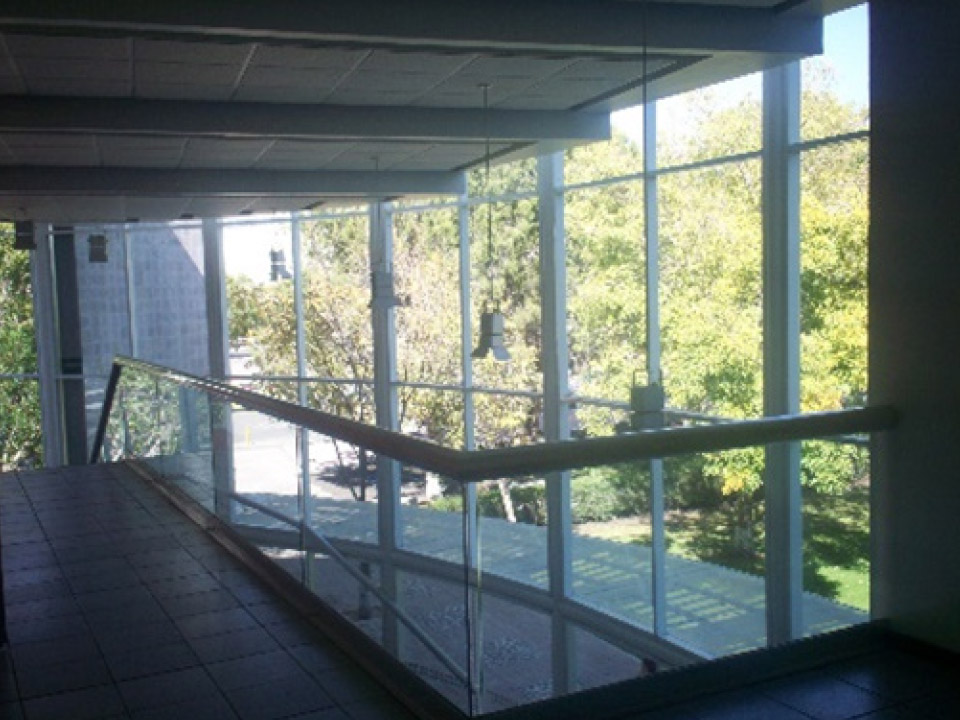
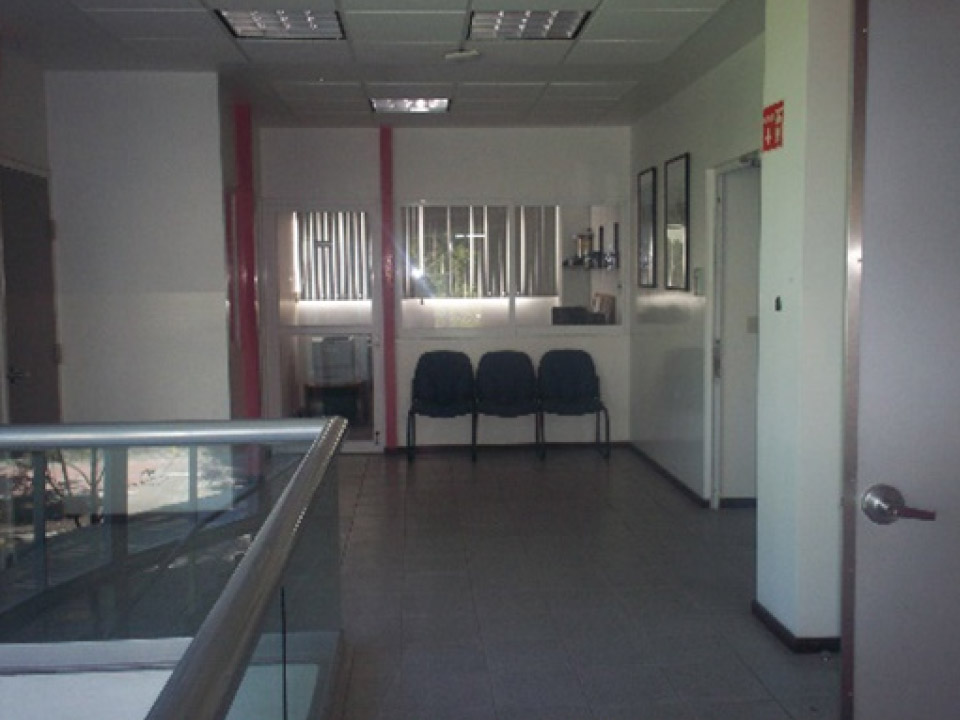
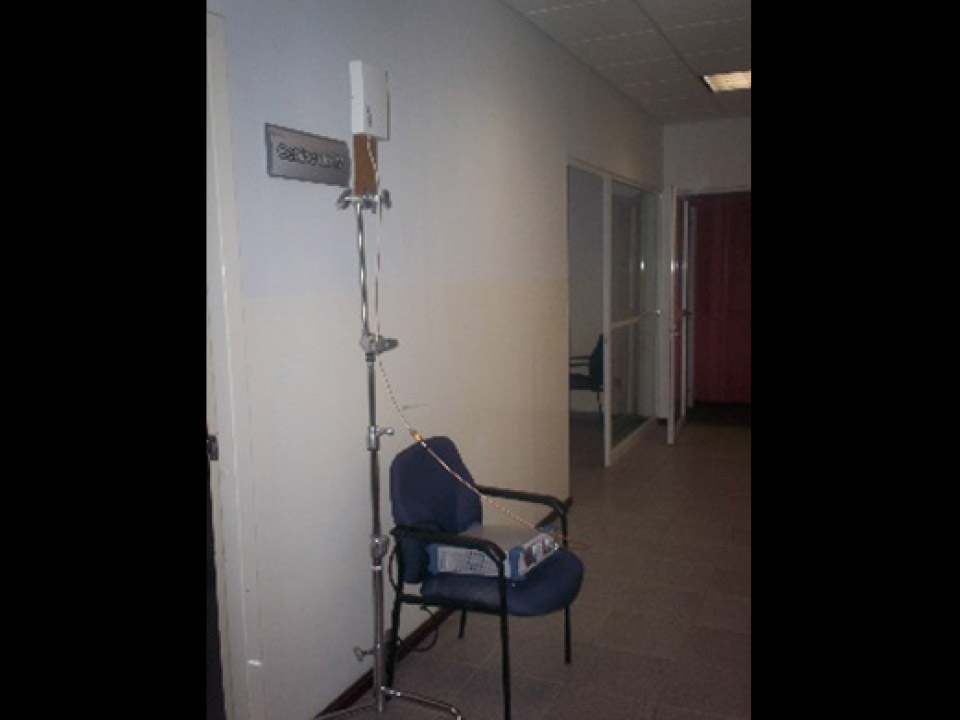
The Engineering and Electronics Center building is located on the north side of the campus. The inner walls are mostly made of drywall, while the outer walls are concrete. Surveys were conducted at 700, 850, and 2400 MHz on Level 2, where various electronics and electrical engineering labs are located. The 1900 MHz survey was taken on Level 3, where faculty members from the Mechanics, Electronics, and Computer Science departments have offices.
Figure 2:
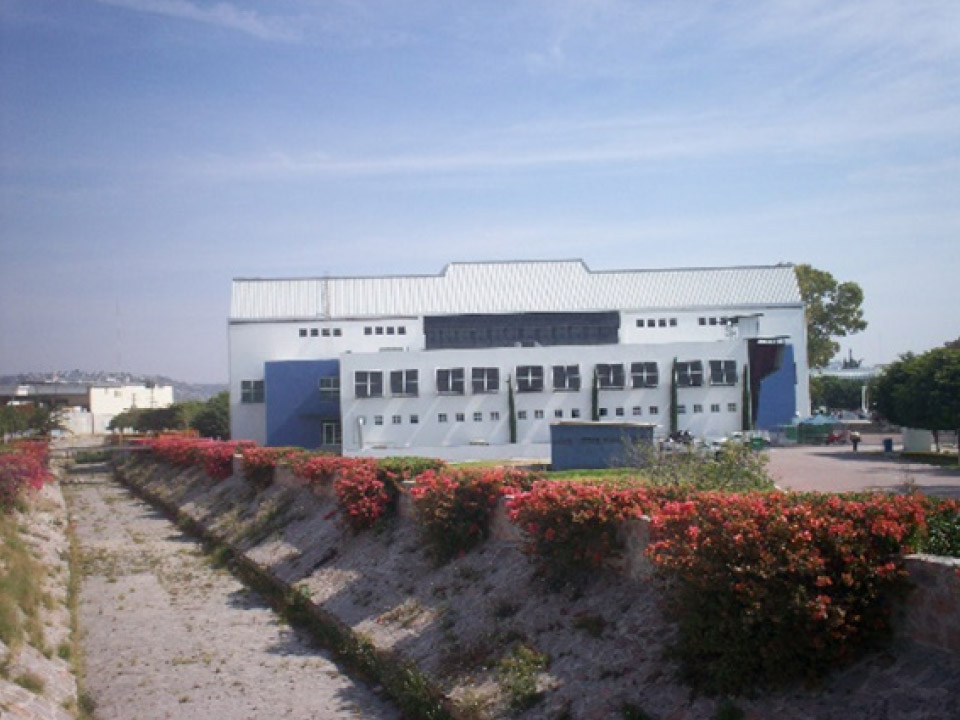
Building 2 exterior.
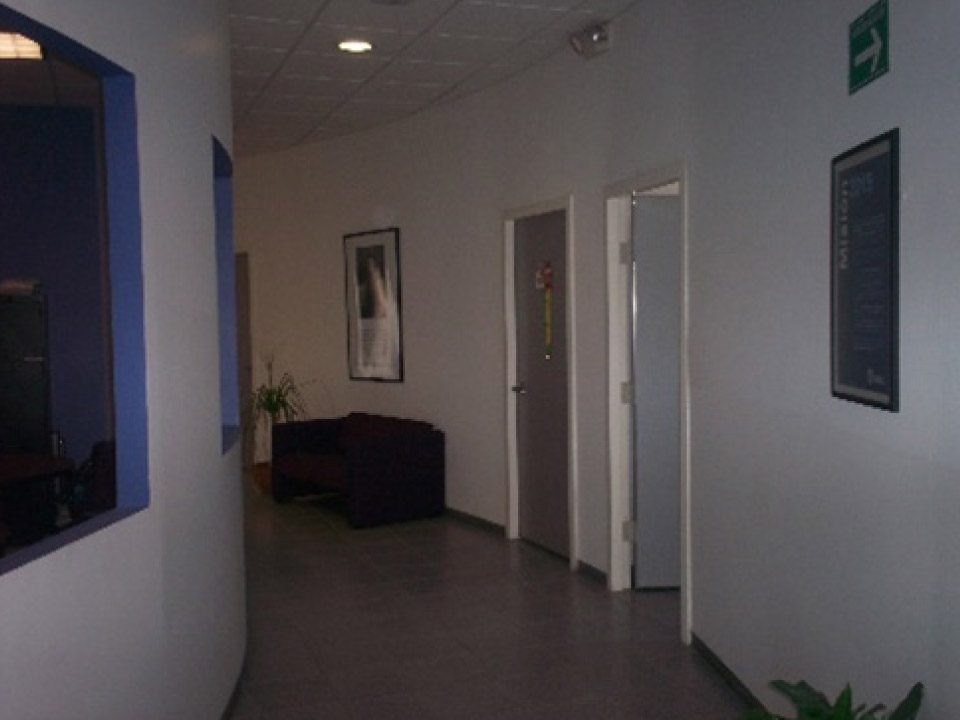
Figure 3:
Level 2 interior and measurement setup (700, 850 & 2400 MHz).
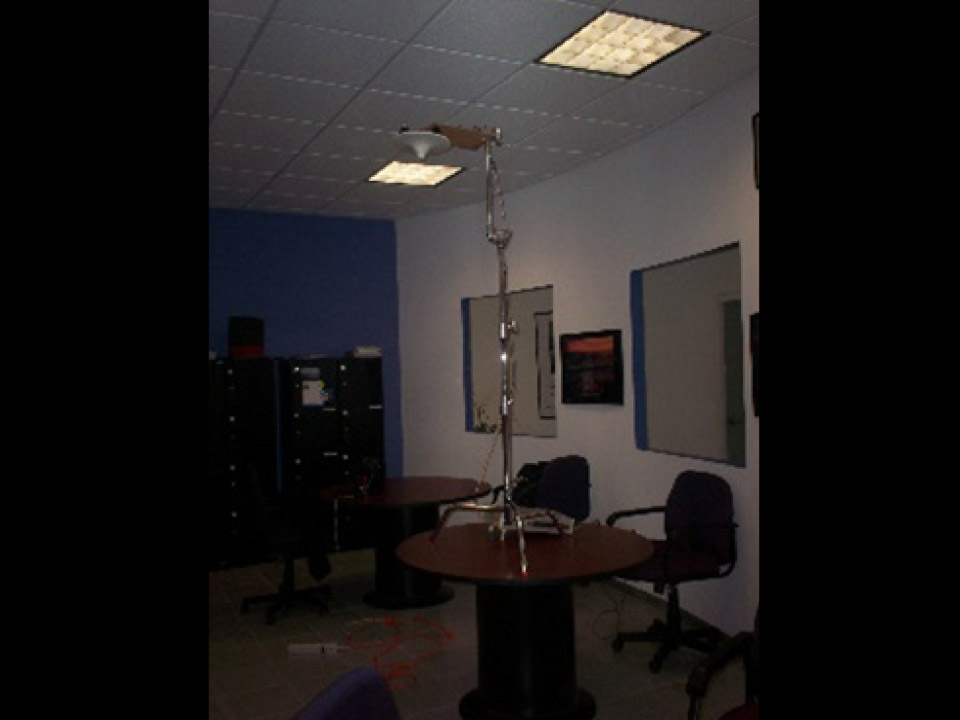
Figure 4:
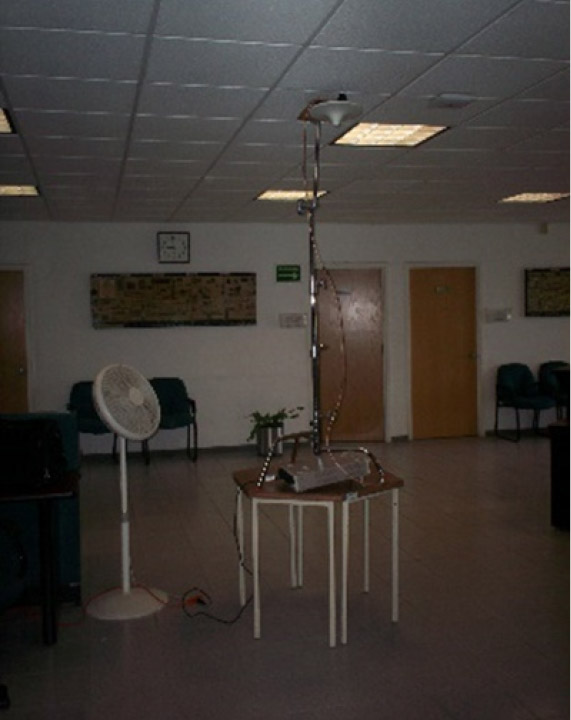
Level 3 interior and measurement setup (1900 MHz).
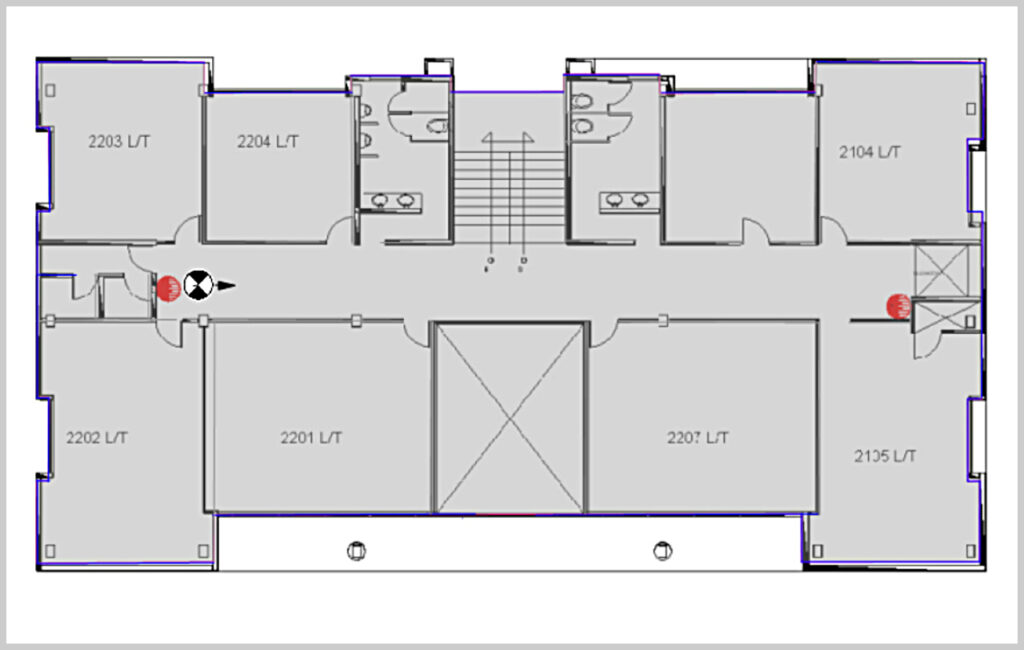
Level 2 plan and directional antenna location.
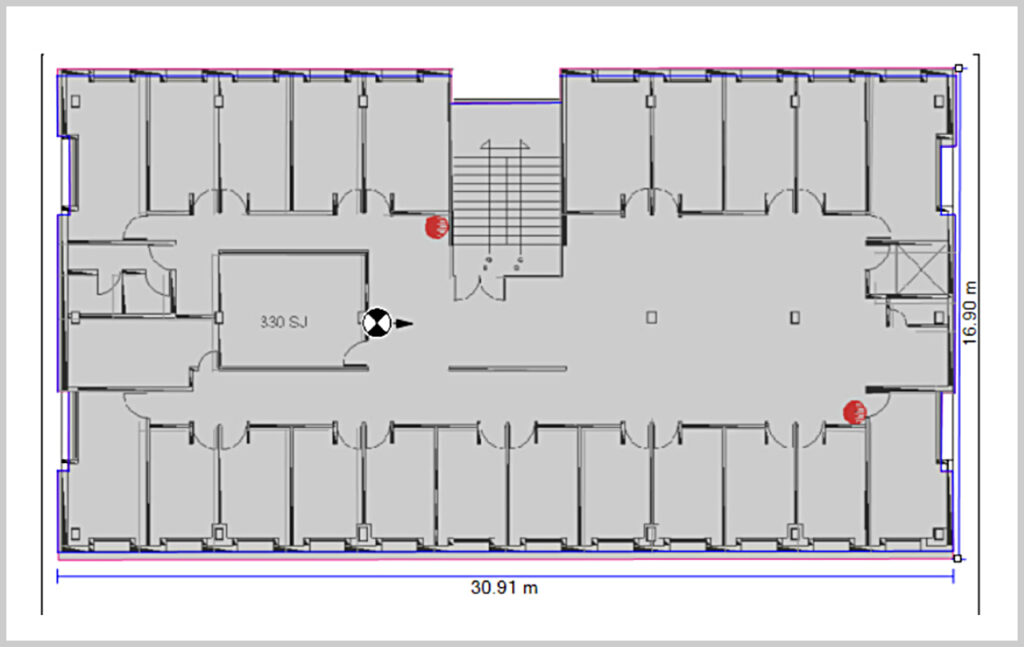
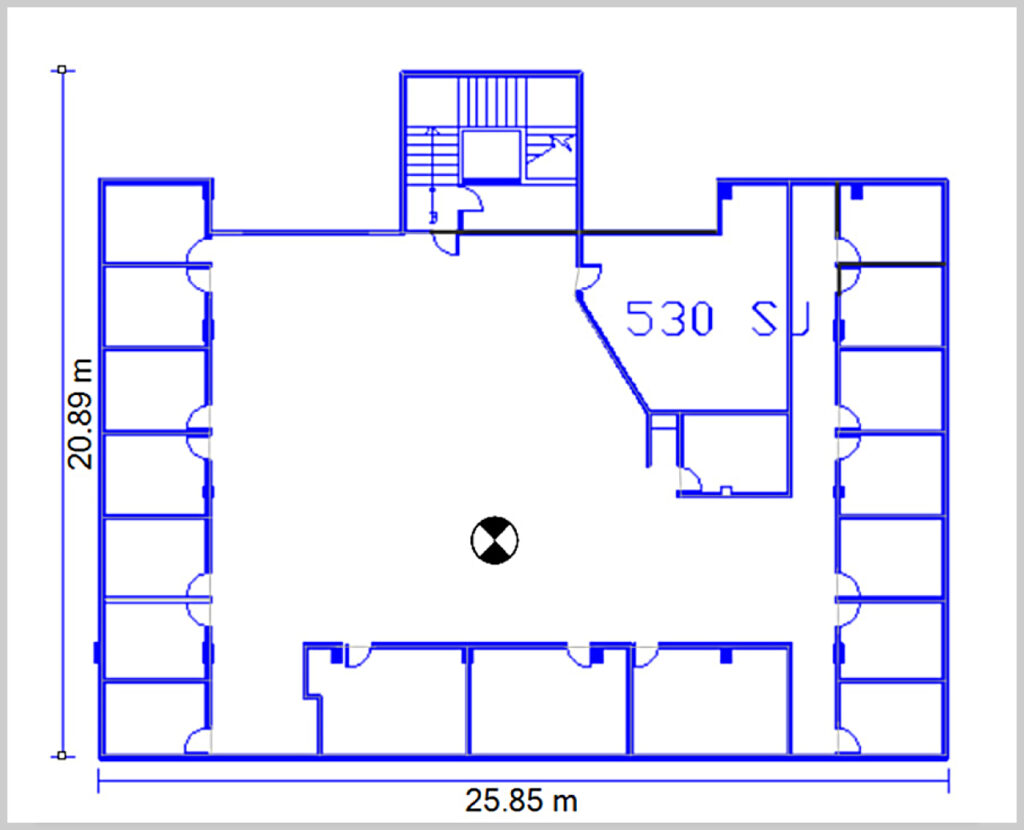
Level 3 plan and directional antenna location.
Building 5 – Agronomy, Food and Sciences
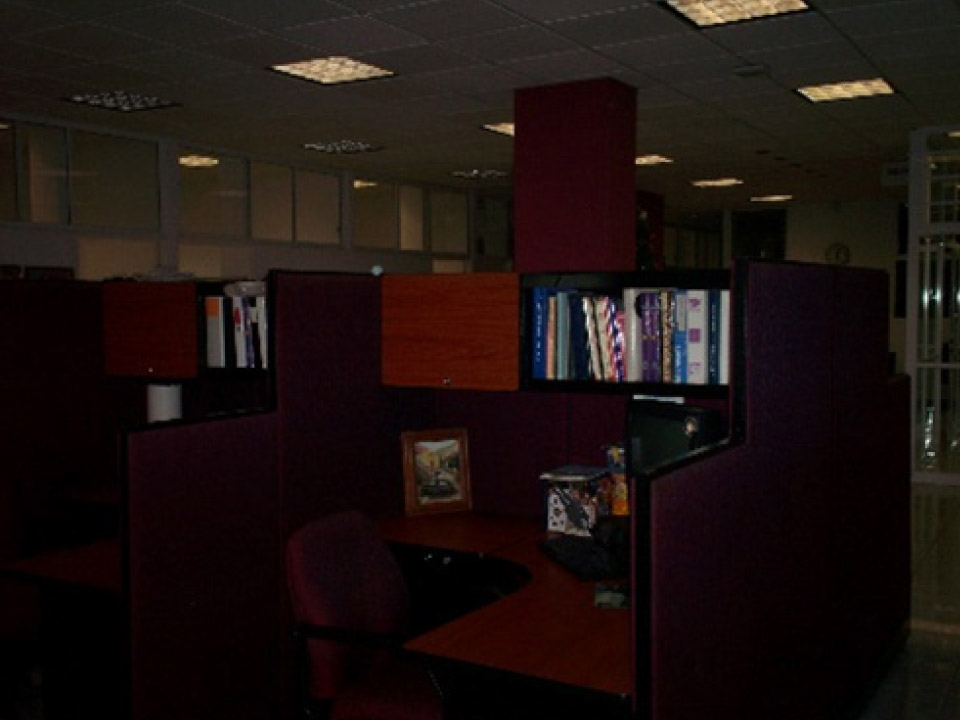
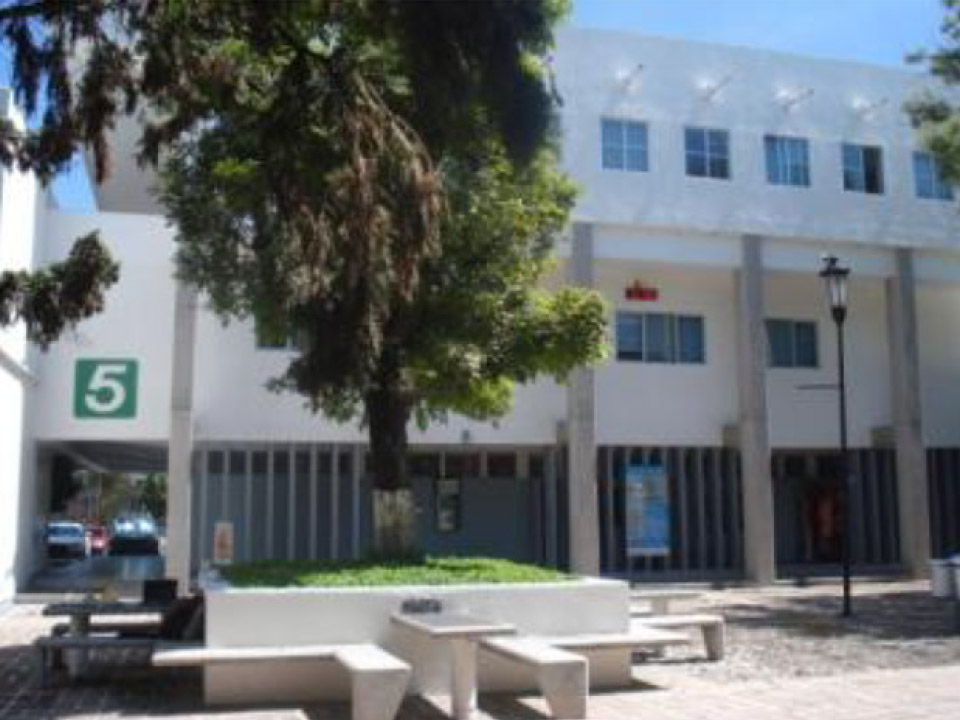
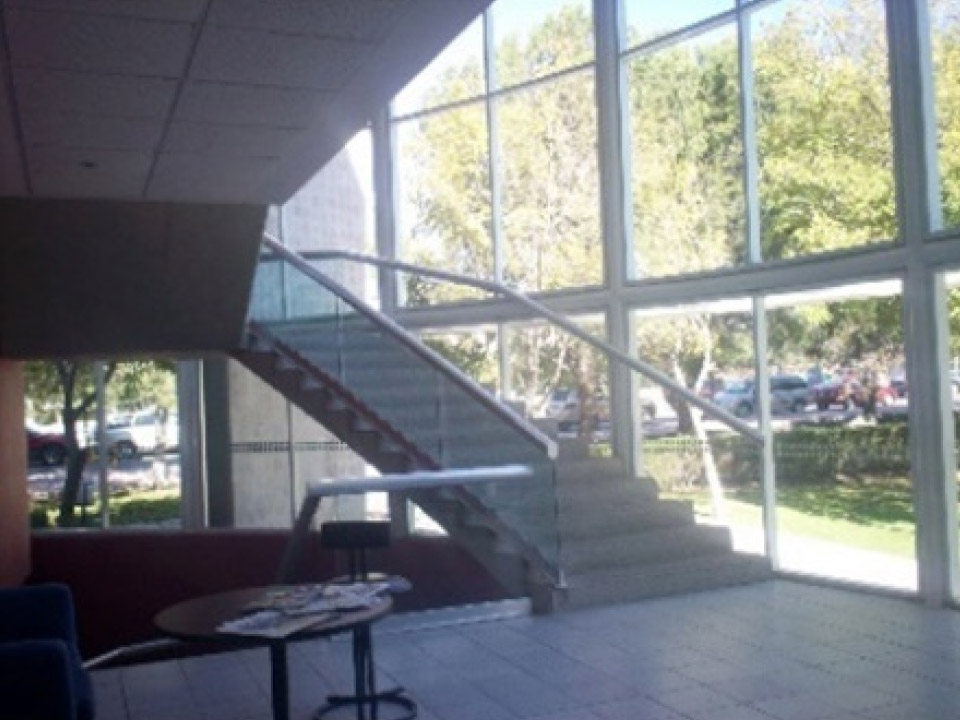
Building 5 houses offices and labs for Food, Engineering, Biotechnology, Agronomy, and Science. The 850 MHz survey was conducted on the third level, which is occupied by offices only. The walls between the offices are made of plaster, while the outer walls are made of concrete.
Figure 7:
Building 5 exterior and Level 3 interior.
Building 8 – Congress Hall
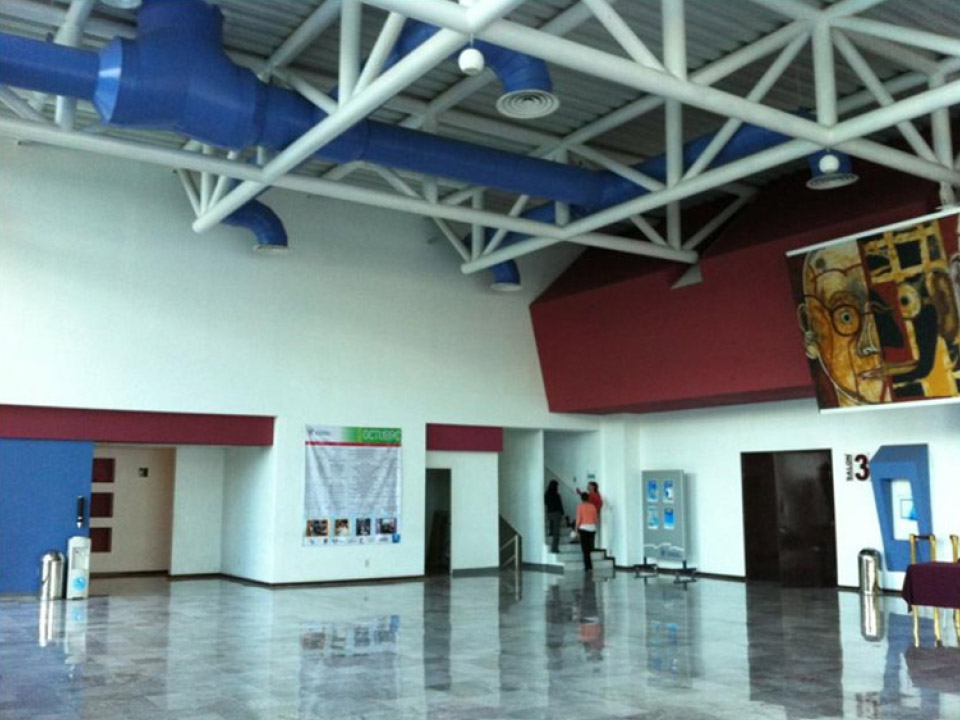
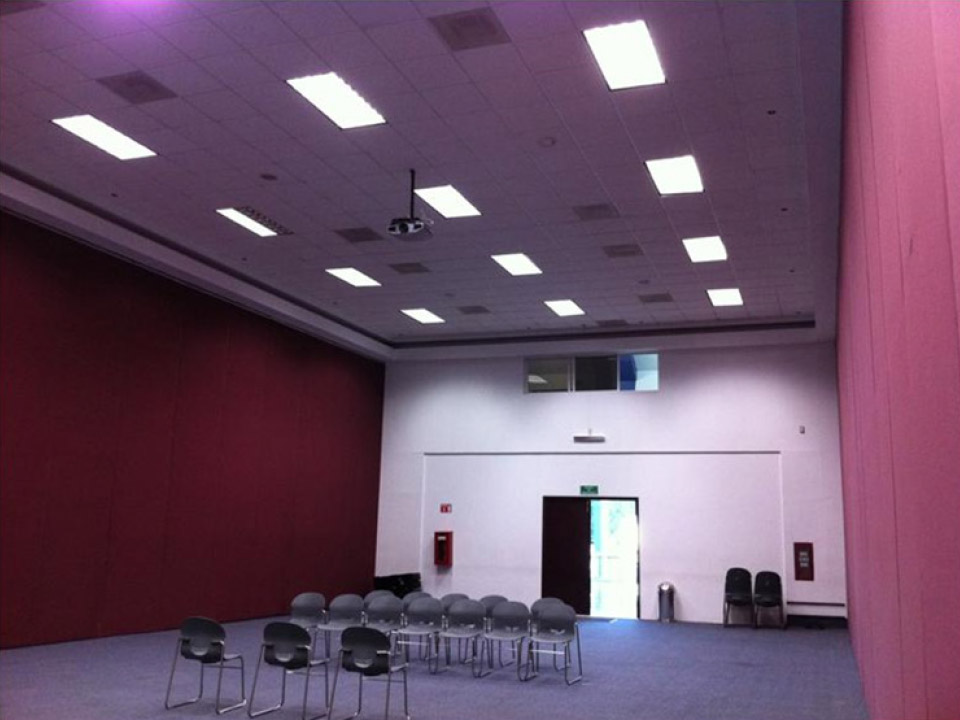
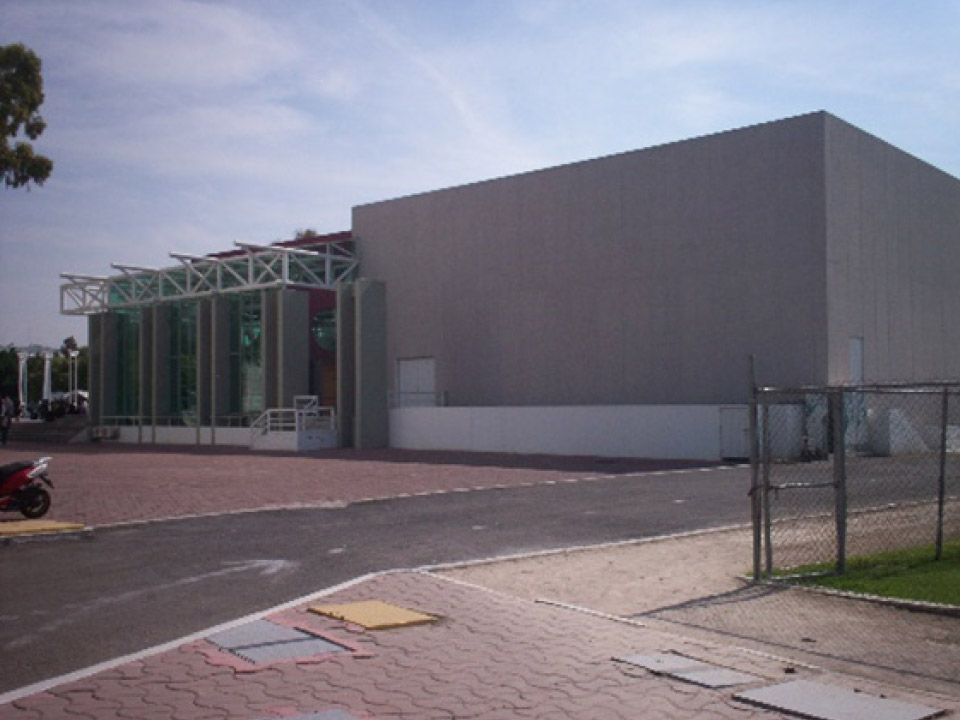
Building 8 is a conference and events building used for major events, including graduation ceremonies. The outer walls are made of concrete, while the walls of the three conference rooms are made of wood covered by fabric. Other inner walls are made of plaster. The 1900 MHz survey was taken with a directional antenna on Level 1.
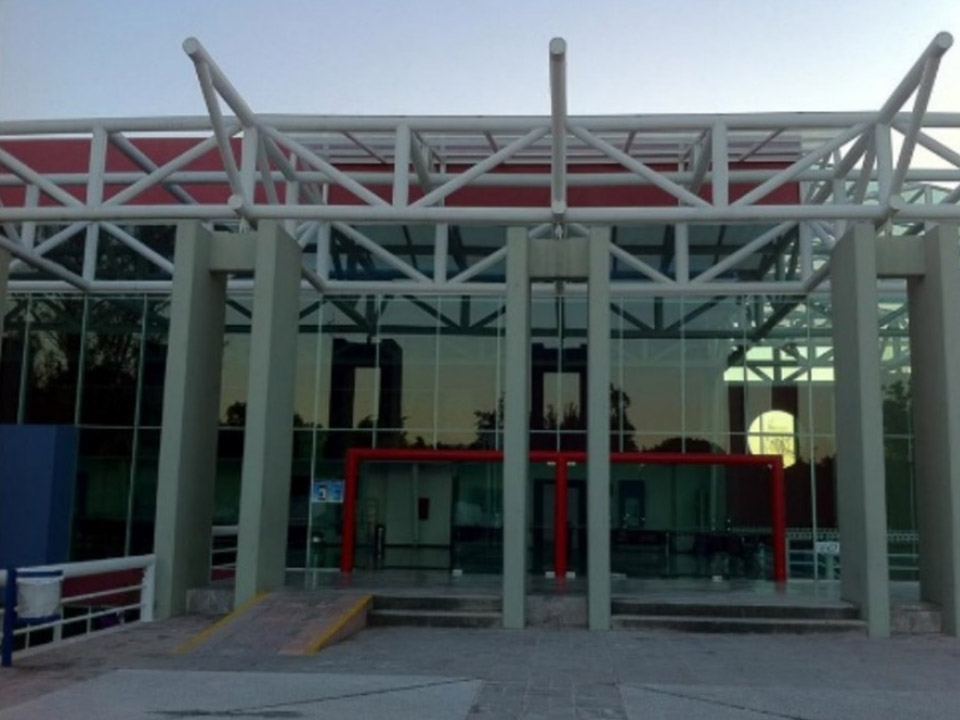
Building 8 exterior.
Figure 11:
Building 8 Level 1 interior.
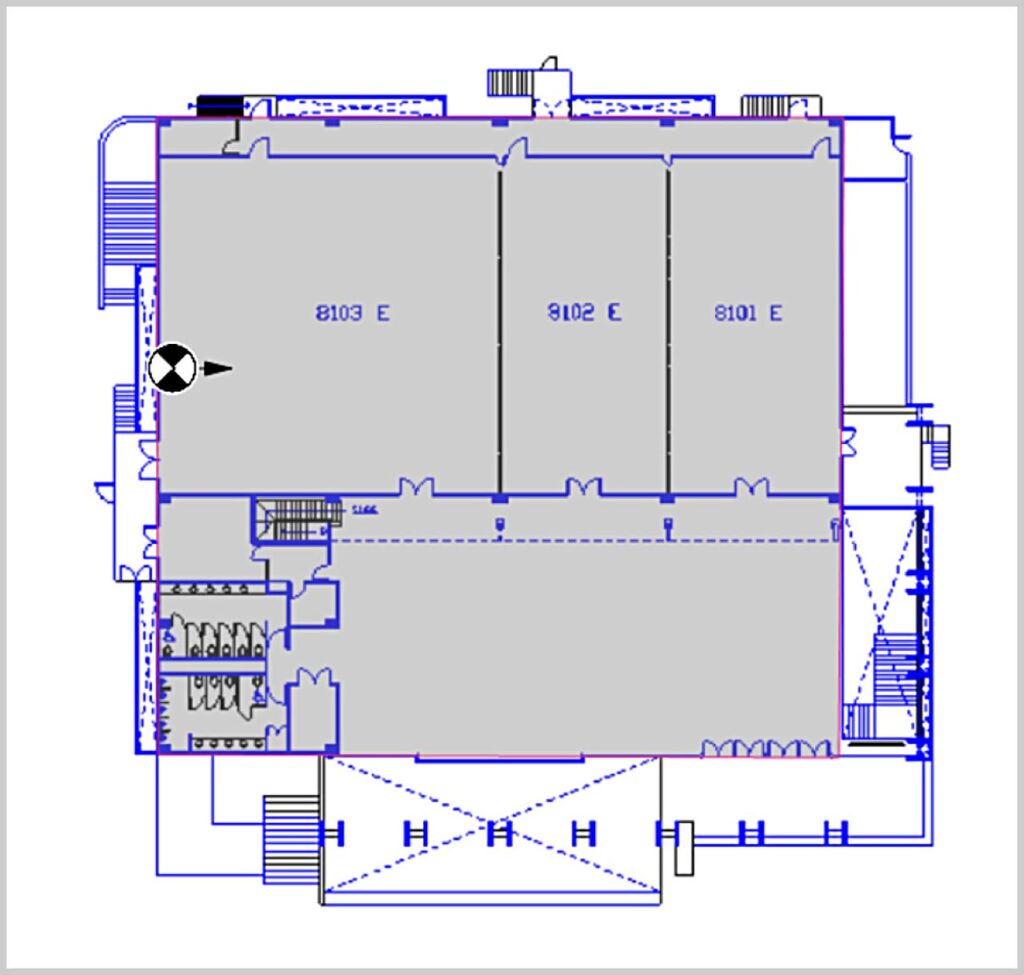
Building 8 Level 1 plan and directional antenna location.
Building 9 – Comprehensive Training Center
The Comprehensive Training Center is a multipurpose building that features the University Gym and Auditorium on the first level. The auditorium is used for graduation ceremonies, basketball, and volleyball games. Part of the third level includes spectators’ seats. The ground level, where the 850 MHz survey was conducted, consists of classrooms and dance rooms.
Figure 13:
Building 9 exterior.
Figure 14:
Building 9 Basement interior and measurement setup.
Another 850 MHz and several 3200 MHz surveys were taken on Level 2:
Figure 15:
Building 9 Level 2 and measurement setup.
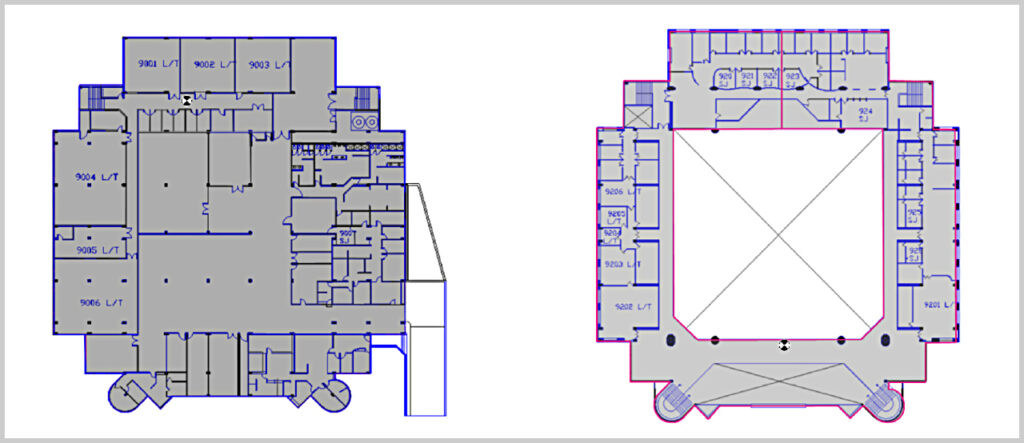
Building 9 Basement level and Level 2 antenna location.
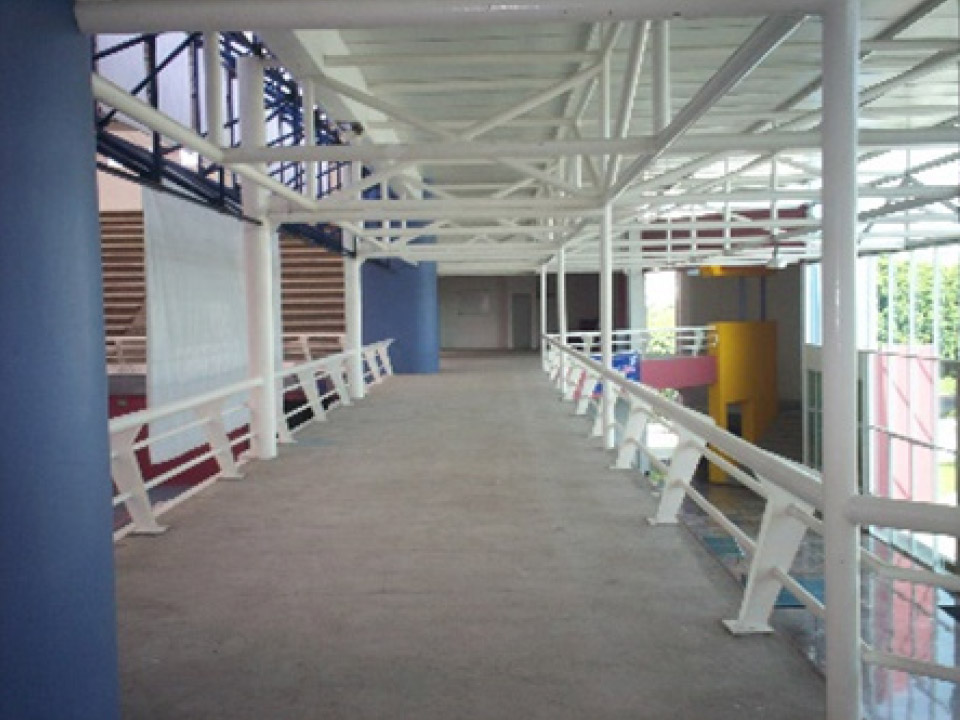
Another set of measurements at 1900 and 2400 MHz was taken at Level 3, where the spectators’ seating area is. The directional antenna is above the last row, pointing down at a 45-degree angle.
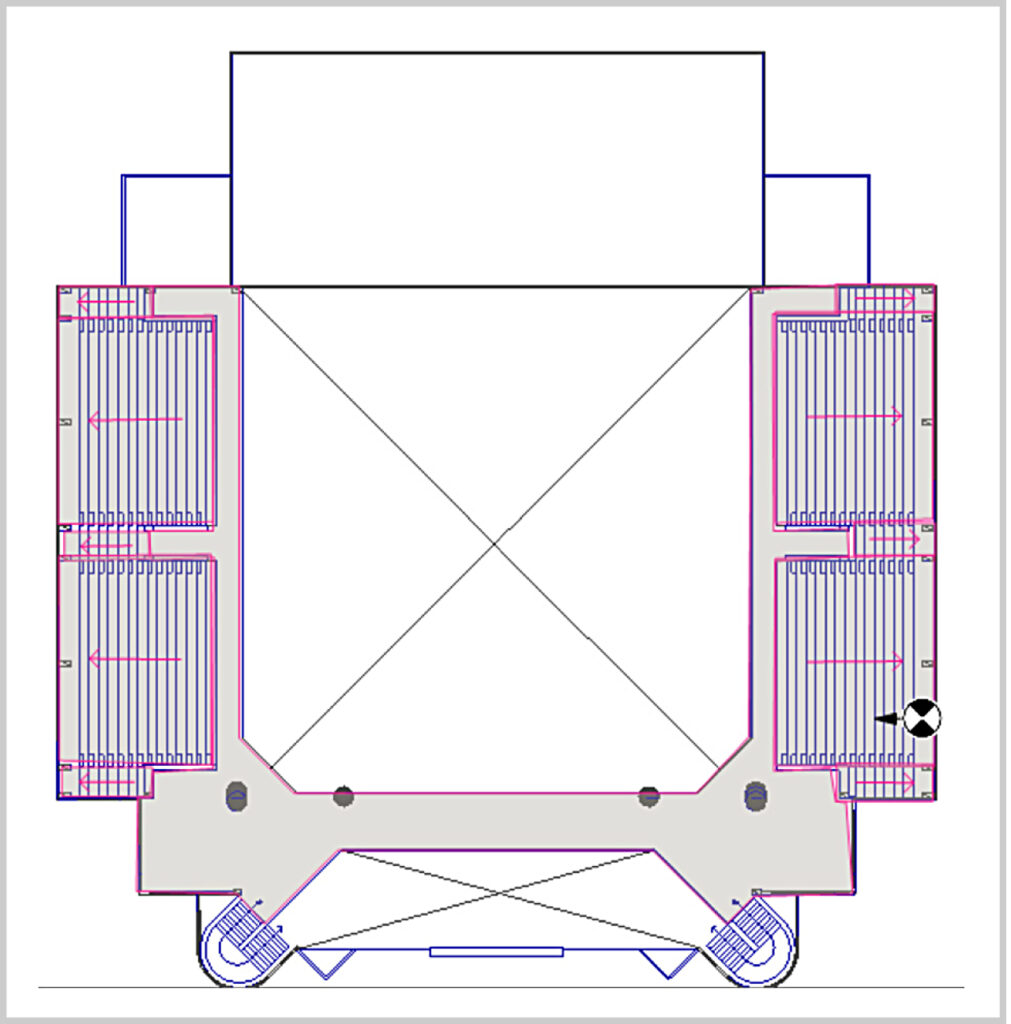
Building 9 Level 3 antenna location.
Building 10 – Media Center
Building 10 is a media center with facilities for radio interviews, TV sets, digital art design, and creative labs. The exterior walls are concrete blocks, and most rooms have walls made of sheetrock, except for the two studios where the walls are made of fiberglass. The front walls and most doors of every room are made of thick glass. CW surveys were conducted at 700, 850, and 2400 MHz, on Level 1 and at 1900 MHz on Level 2.
Figure 18:
Building 10 Level 1 interior and measurement setup.
Figure 19:
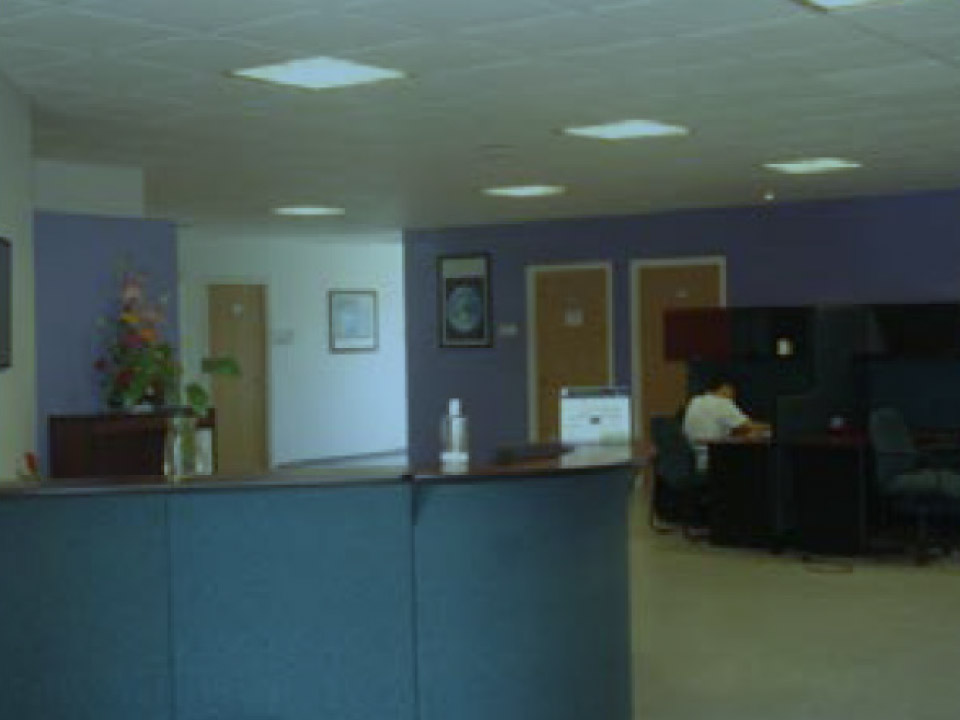
Building 10 Level 2 interior and measurement setup.
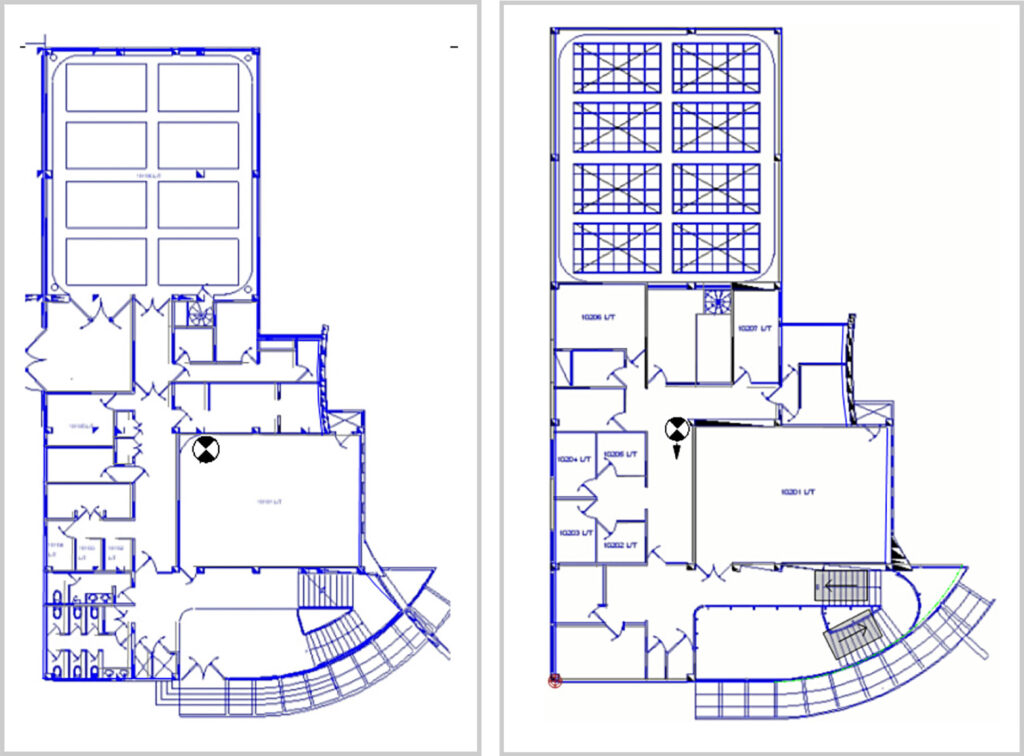
Building 10 Level 1 and 2 with antenna locations.
Building 11 – Preparatory
Building 11 is a mix of classrooms and faculty offices. The building is opposite the CIE building (Building 2), as shown in the map below. This building has cylindrical structures where the faculty offices are located. Most of the building walls are made of concrete, except for the office walls, which are made of plaster. 850 and 1900 MHz surveys were conducted on Level 1 and Level 2 of this building.
Figure 21:
Building 11 exterior, interior, and measurements setup.
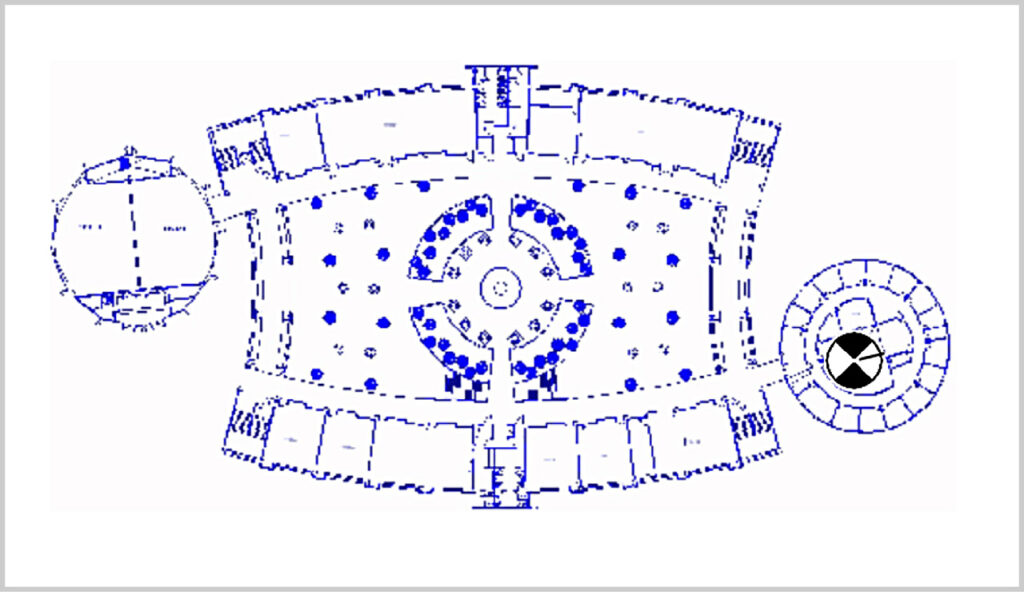
Building 11 Level 1 plan with omnidirectional antenna location.
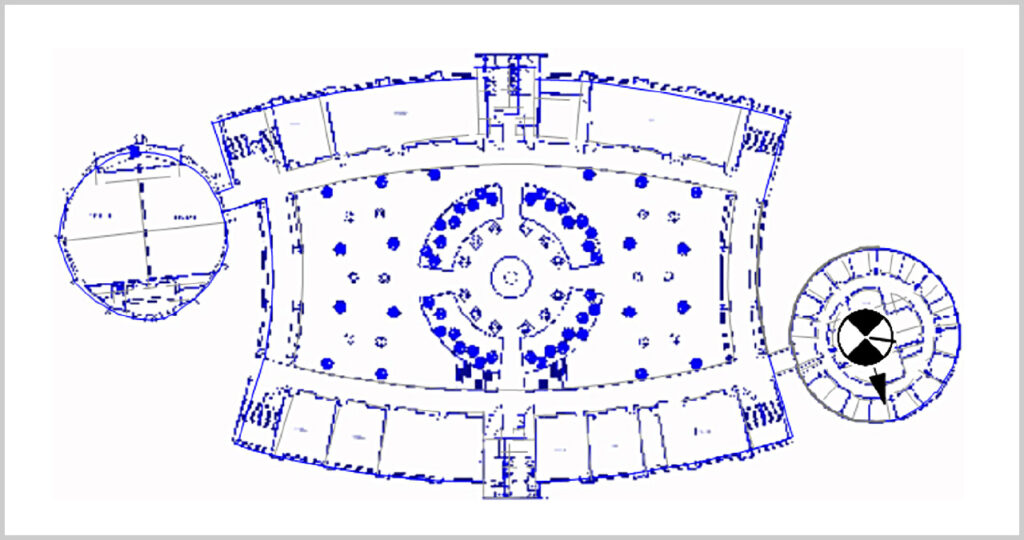
Building 11 Level 2 plan with directional antenna location.
Montreal Venues (Canada)
The venues at which surveys were conducted in Montreal were:
For all three venues, the CW measurements campaign was conducted using the following measurement equipment:
Bell Center (NHL Arena)
Bell Center arena is an indoor arena with 20,000 seats and a footprint of about 15,500 square meters (100m x 155m). It is primarily used for professional hockey games but is also used for entertainment and business events. Inside the arena, the seating area is spread across 7 levels. At the venue, an omnidirectional antenna was used at 3 different locations, labeled as antenna 1, 2, and 3. Antenna 1 was placed on Level 2B, and 5 CW data sets were recorded on Level 2B. Antenna 2 was placed on Level 1, and 5 CW data sets were recorded on Level 1 and Level 2B. Antenna 3 was placed on Level 7, and 2 CW data sets were recorded on Level 2B. The summary of all antenna and data set locations is presented in the following table:
| ANTENNA | ANTENNA POSITION | SURVEY TRACE | SURVEY PLACEMENT |
|---|---|---|---|
| Antenna 1 | Level 2B | Corridor | Level 2B |
| Interior Bowl | Level 2B | ||
| Antenna 2 | Level 1 | Backstage | Level 1 |
| Backstage Return | Level 1 | ||
| Visitors’ Locker Room | Level 1 | ||
| Interior Bowl | Level 2B | ||
| Antenna 3 | Level 7 | Interior Bowl | Level 2B |
| Corridor | Level 2B |
Measurement Setup at the hockey arena.
Rockland Center
Rockland Center is a large three-level shopping center with a footprint of about 37,000 square meters (approximately 310m x 120m). At this center, we used an omnidirectional antenna at four different locations. Antenna 1 was placed on Level 2, and four CW data sets were recorded on two different levels (Level 2 and Level 3). Antenna 3 was placed on the same level as antenna 1 but in a different location, and four CW data sets were recorded on Level 2 and Level 3. Antenna 4 was placed on Level 3, where two CW data sets were taken. Finally, Antenna 5 was also placed on Level 3 but in a different location, and four CW data sets were recorded on Level 2 and Level 3. The antenna locations are shown in Figure 21 and 22 below:
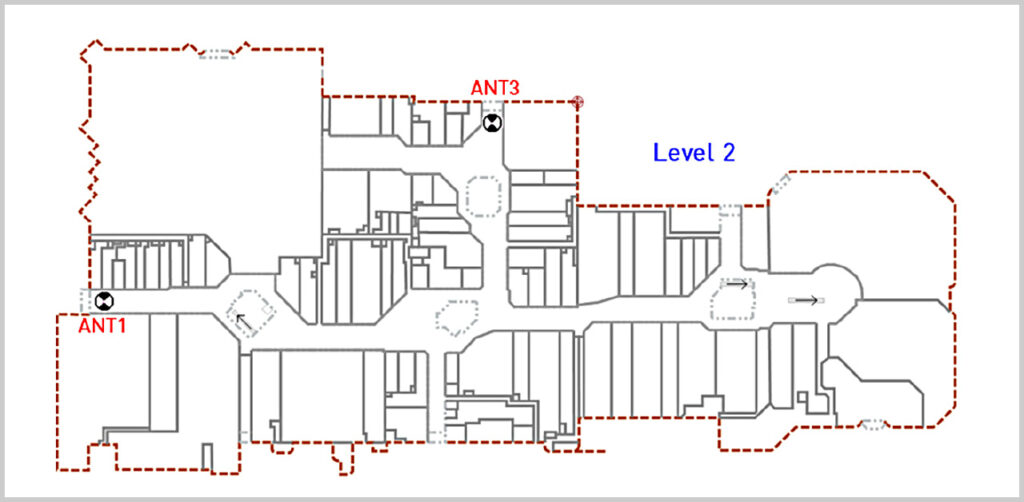
Antennas 1 and 3 in Rockland Center (Level 2).
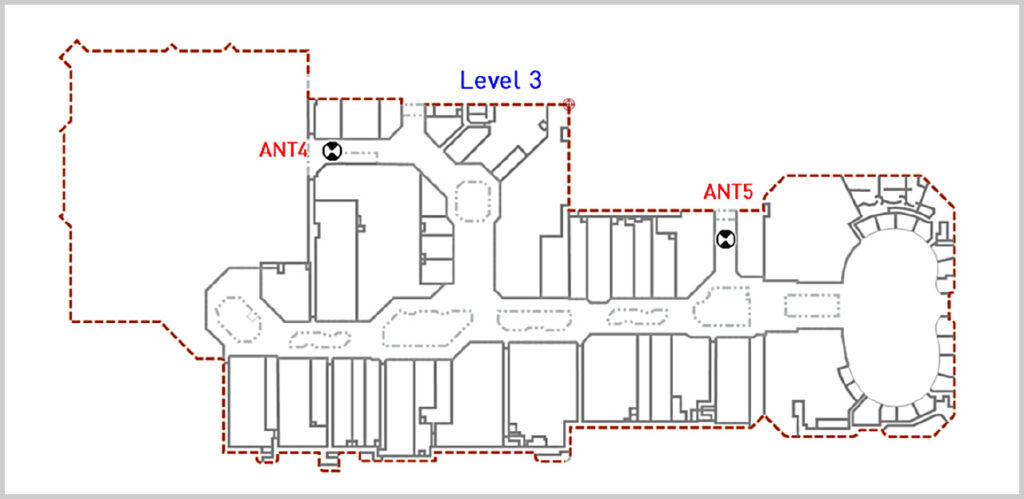
Antennas 4 and 5 in Rockland Center (Level 3).
Old iBwave Headquarters
The old iBwave HQ office is a single-level venue with a footprint of about 748 square meters (approximately 34m x 22m). In the office, an omnidirectional antenna was used at three different locations. At locations 1, 2, and 3, the output transmit power was 15 dBm, but the power was reduced to -15 dBm at location 4. Locations 3 and 4 are collocated, and the different power levels were used to test the prediction algorithm when the transmit power is changed. The antenna locations are shown in the following figure:
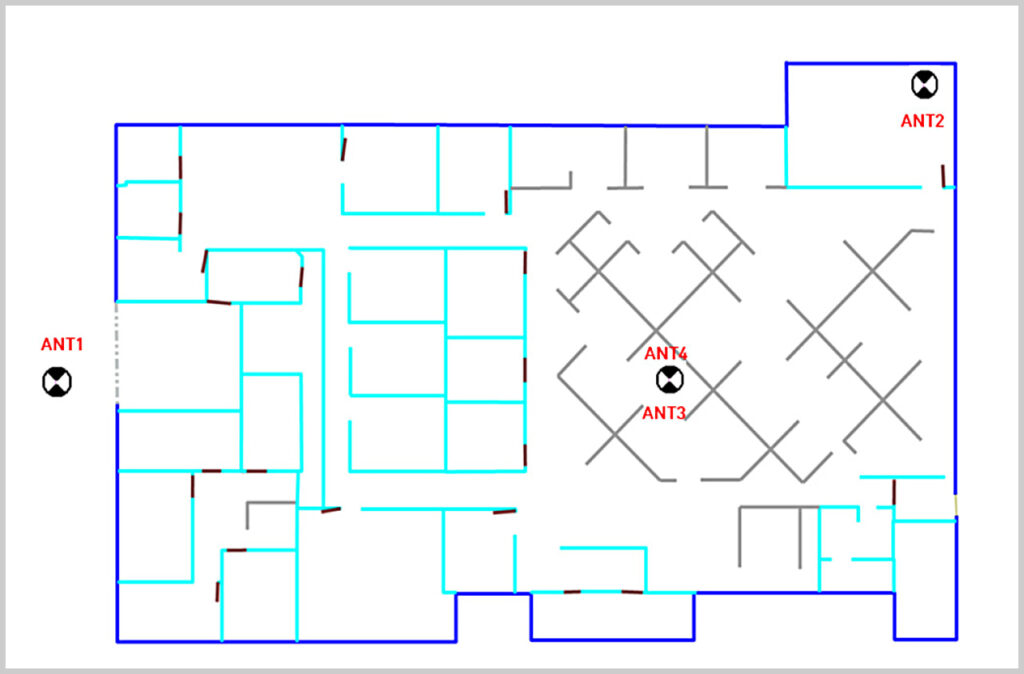
Antenna locations at iBwave Headquarters.
Bossa Nova Mall (Brazil)
QMC Telecom International is a prominent owner, developer, and operator of indoor DAS systems in Latin America. They have deployed over 142 million square feet of coverage and possess an experienced in-house engineering team. This team has successfully implemented more than 10,000 DAS sites globally. Recently, QMC conducted a trial of a 5G NR network at Bossa Nova Mall in Brazil. This mall is part of a hotel/mall complex attached to Santos Dumont Airport in Rio de Janeiro. The trial network operated in a 100 MHz TDD channel at 3.5 GHz. QMC Telecom shared the coverage data of one irradiation point located in the food court on the Mezzanine level:

Food court at the Mall with irradiation point locations (Mezzanine Level).
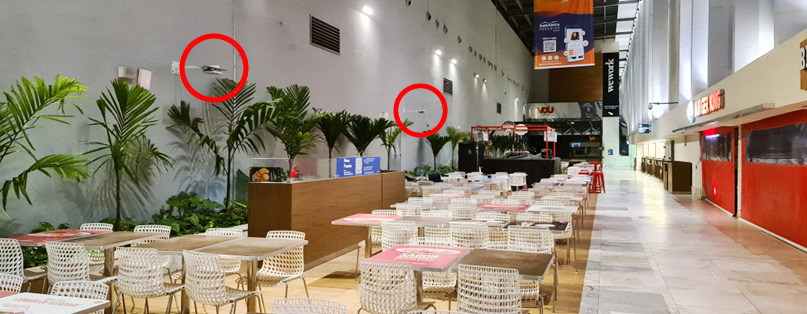
A photograph of irradiation points in the food court.
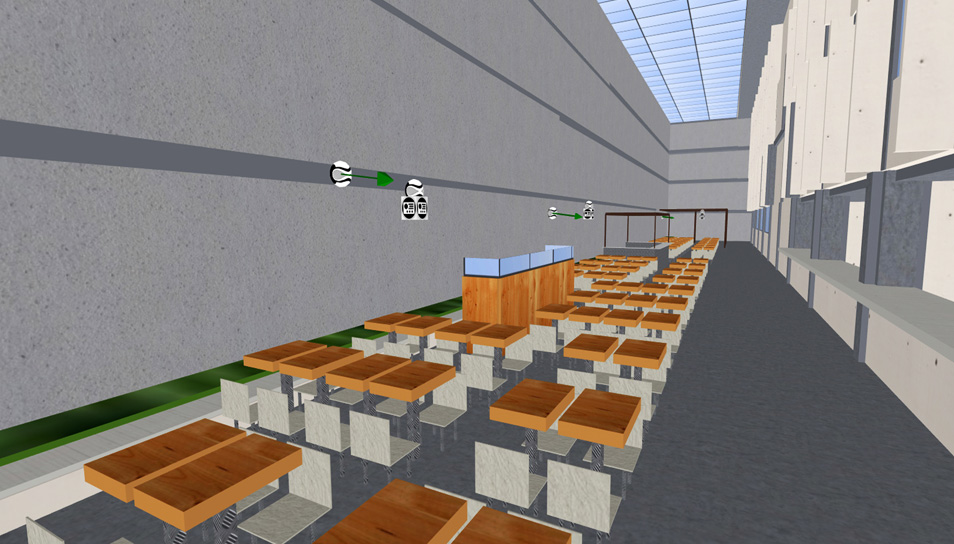
Irradiation points as modelled in iBwave Design.
5G NR signal source is an 8×8 MIMO Remote Radio Unit, connected to in-building network as shown below:

5G NR trial network architecture schematics.
The 5G NR RF survey data was collected using a Samsung Galaxy Z Fold4 phone.
Consultix Office (Egypt)
This 28 GHz CW survey was conducted by Consultix, an OEM specializing in survey hardware. Consultix used their own CW transmitter and scanner at their office in New Cairo, Egypt. The following equipment was used in the survey:
In the building, omni-directional antenna was placed at four different locations:
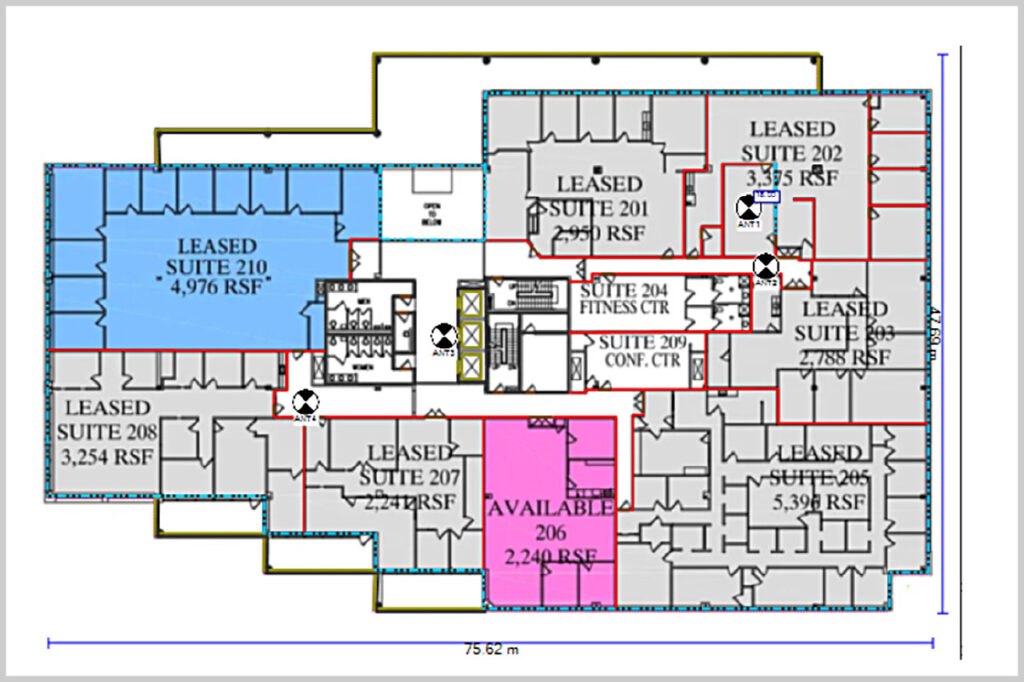
Consultix office with 4 antenna locations.
Prediction And Measurement Results
To compare the predicted and measured data, the Fast Fading component must be eliminated by “smoothing” it out from the field data. Fast Fading data is undesirable as it contains multipath information from the transmitter-receiver path, while the FRT prediction does not. The averaging process (“smoothing out”) of the Fast Fading component can be achieved by setting an averaging “window” of size d (in meters). Inside the window, CW data is averaged out. The averaged value is then assigned a coordinate within the window, and the process is repeated in adjacent windows. This process is easily achieved within the software using an automated algorithm to smooth the field data.
700 MHz
Building 2
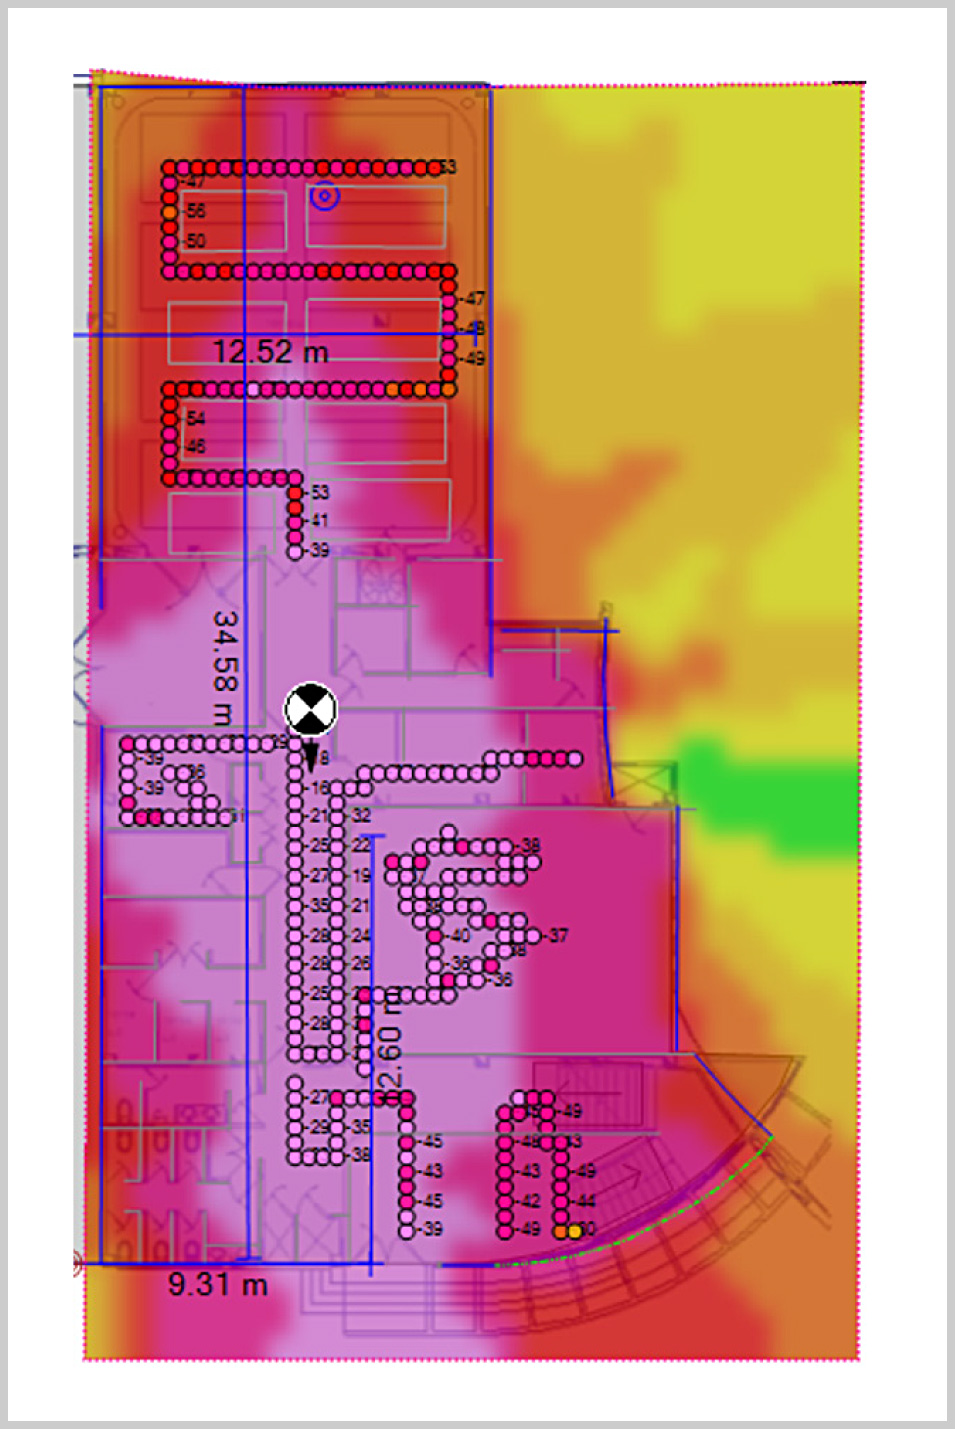
On the second level of Building 2, a CW coverage survey at 700 MHz was conducted using a directional antenna located at the end of a long hallway that connects various laboratories. The following figure shows the Default FRT coverage prediction superimposed over the CW survey, with Fast Fading averaged out.
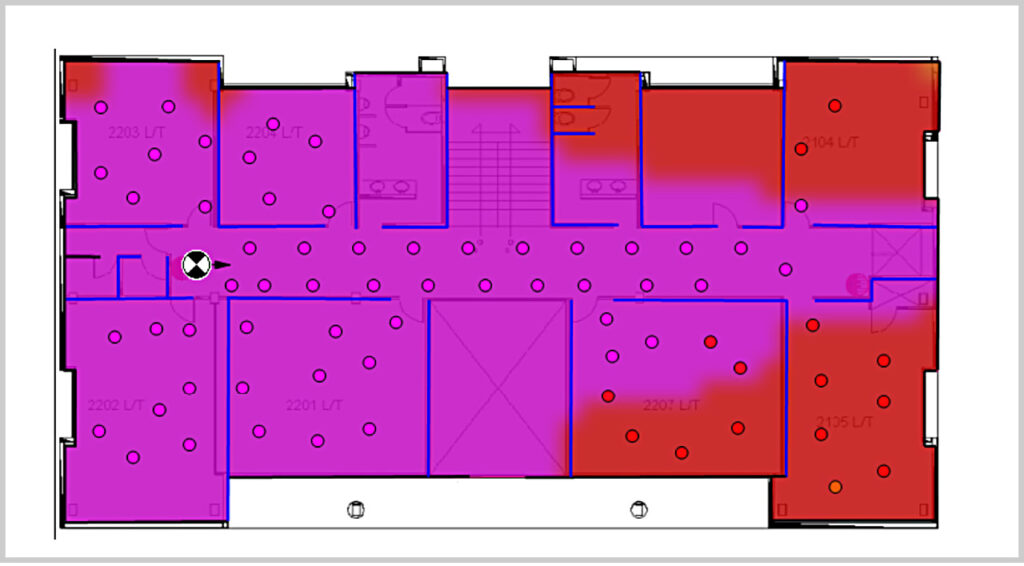
Predicted and measured CW coverage at 700 MHz in Building 2, Level 2.
The following table summarizes prediction accuracy:
| Prediction vs measured data summary Value (dB) | |
|---|---|
| Mean error (μ) | -2.52 |
| Absolute mean error (μ) | 3.86 |
| Standard deviation (σ) | 3.79 |
Predicted versus measured data:
Building 2, Level 2, 700 MHz.
Building 10
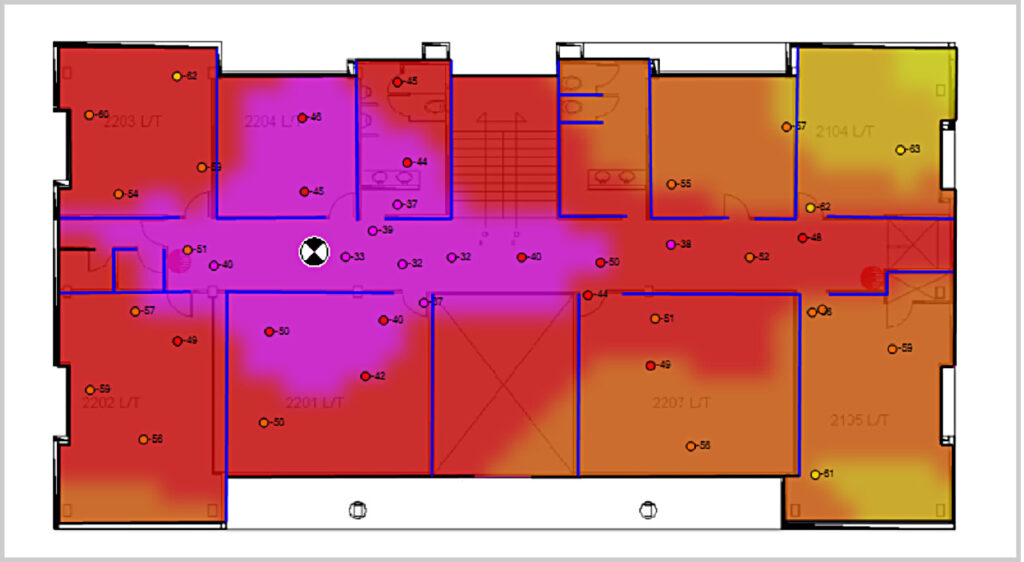
On the first level of Building 10, a CW coverage survey at 700 MHz was taken using a directional antenna located in the middle. The following figure shows the Default FRT coverage prediction superimposed over the CW survey, with Fast Fading averaged out.
Predicted and measured CW coverage at 700 MHz in Building 10, Level 1.
The following table summarizes prediction accuracy:
| Prediction vs measured data summary Value (dB) | |
|---|---|
| Mean error (μ) | -2.35 |
| Absolute mean error (μ) | 4.86 |
| Standard deviation (σ) | 5.89 |
Predicted versus measured data:
Building 10, Level 1, 700 MHz.
850 MHz
Building 2
On the third level of Building 2, a CW coverage survey at 850 MHz was taken using an omnidirectional antenna located on the left side of the main hallway. The following figure shows the Default FRT coverage prediction superimposed over the CW survey, with Fast Fading averaged out.
Predicted and measured CW coverage in Building 2, Level 3.
The following table summarizes prediction accuracy:
| Prediction vs measured data summary Value (dB) | |
|---|---|
| Mean error (μ) | -6.15 |
| Absolute mean error (μ) | 6.74 |
| Standard deviation (σ) | 5.66 |
Predicted versus measured data:
Building 2, Level 3, 850 MHz.
Building 5
On the third level of Building 5, a CW coverage survey at 850 MHz was taken using an omnidirectional antenna located near the center. The following figure shows the Default FRT coverage prediction superimposed over the CW survey, with Fast Fading averaged out.
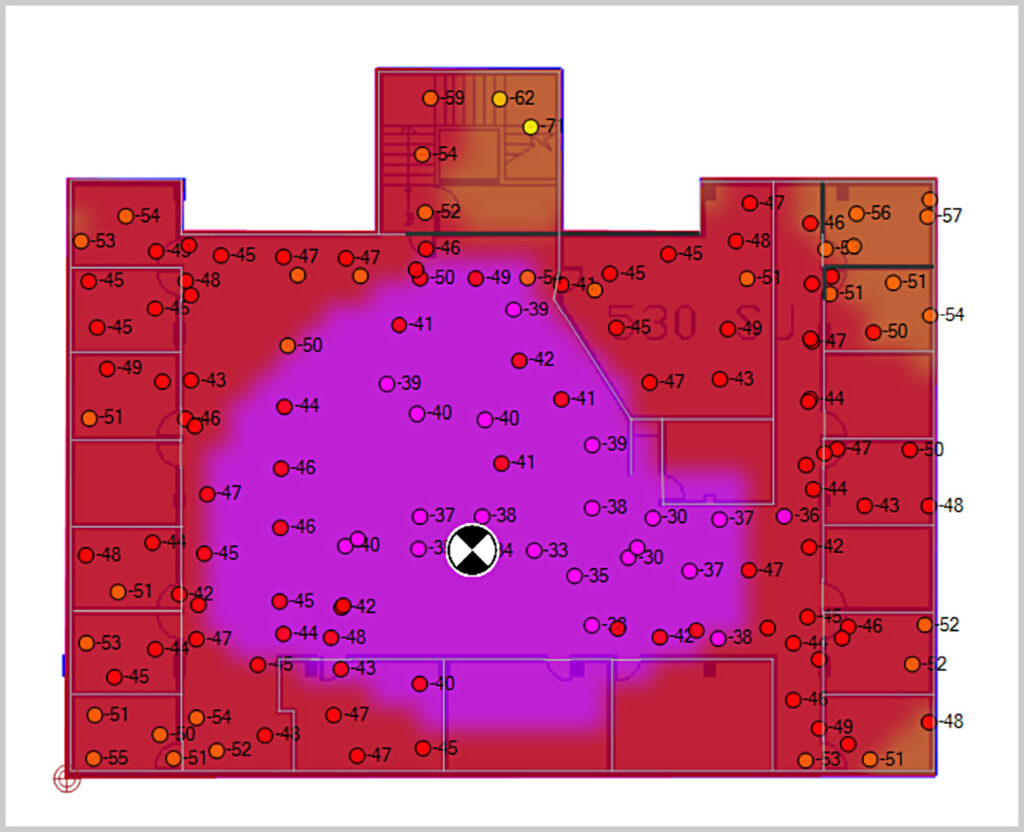
Predicted and measured CW coverage in Building 5, Level 3.
The following table summarizes prediction accuracy:
| Prediction vs measured data summary Value (dB) | |
|---|---|
| Mean error (μ) | -3.51 |
| Absolute mean error (μ) | 4.43 |
| Standard deviation (σ) | 4.17 |
Predicted versus measured data:
Building 5, Level 3, 850 MHz.
Building 9
At the basement level of Building 9, a CW coverage survey at 850 MHz was conducted using an omnidirectional antenna located in the hallway. The following figure shows the Default FRT coverage prediction superimposed over the CW survey, with Fast Fading averaged out.
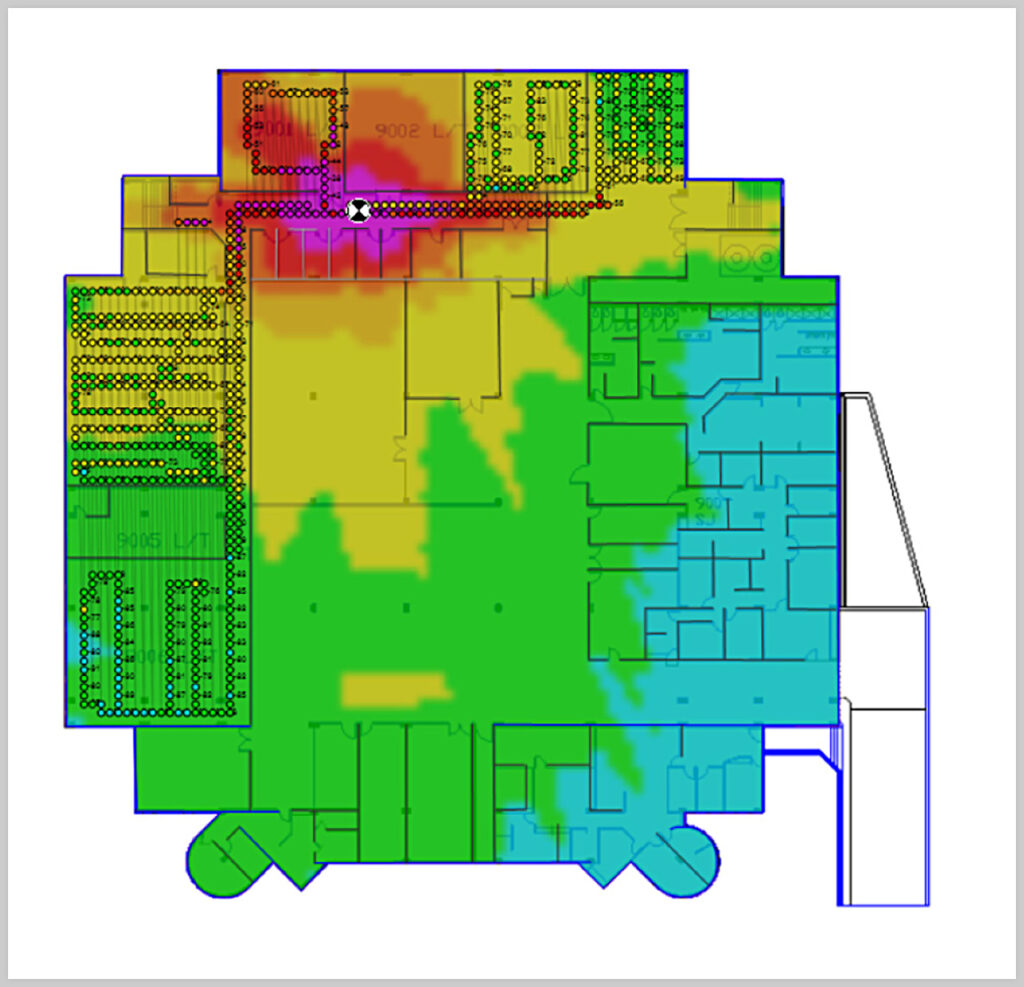
Predicted and measured CW coverage in Building 9, Level 3.
Another 850 MHz survey was taken on Level 2:
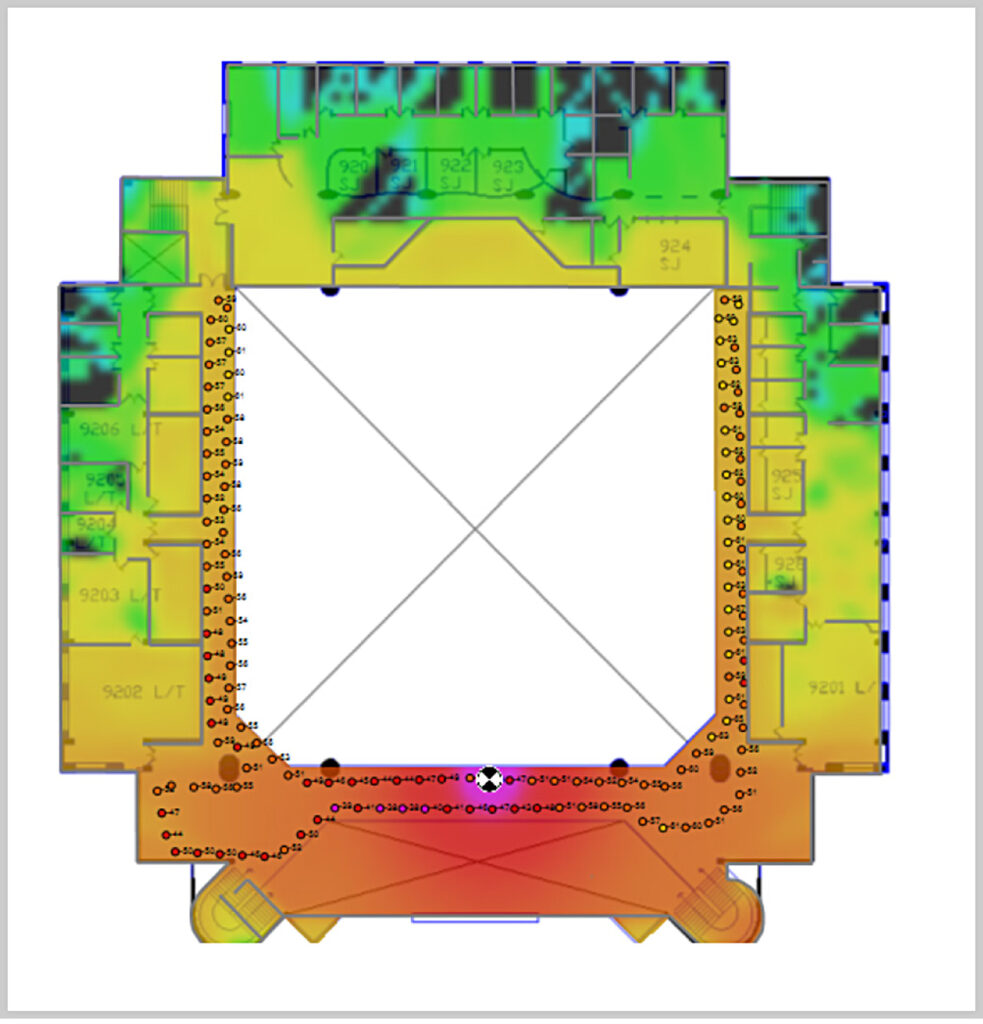
Predicted and measured CW coverage in Building 9, Level 2.
The following table summarizes prediction accuracy at Building 9, 850 MHz:
| MEAN ERROR | ABS MEAN ERROR | STD DEV | |
|---|---|---|---|
| Basement | -0.87 | 4.93 | 6.64 |
| Level 2 | 1.30 | 4.58 | 5.53 |
Predicted versus measured data:
Building 9, 850 MHz.
Building 10
On the first level of Building 10, a CW coverage survey at 850 MHz was taken using an omnidirectional antenna located near the center. The following figure shows the default FRT coverage prediction superimposed over the CW survey, with Fast Fading averaged out.
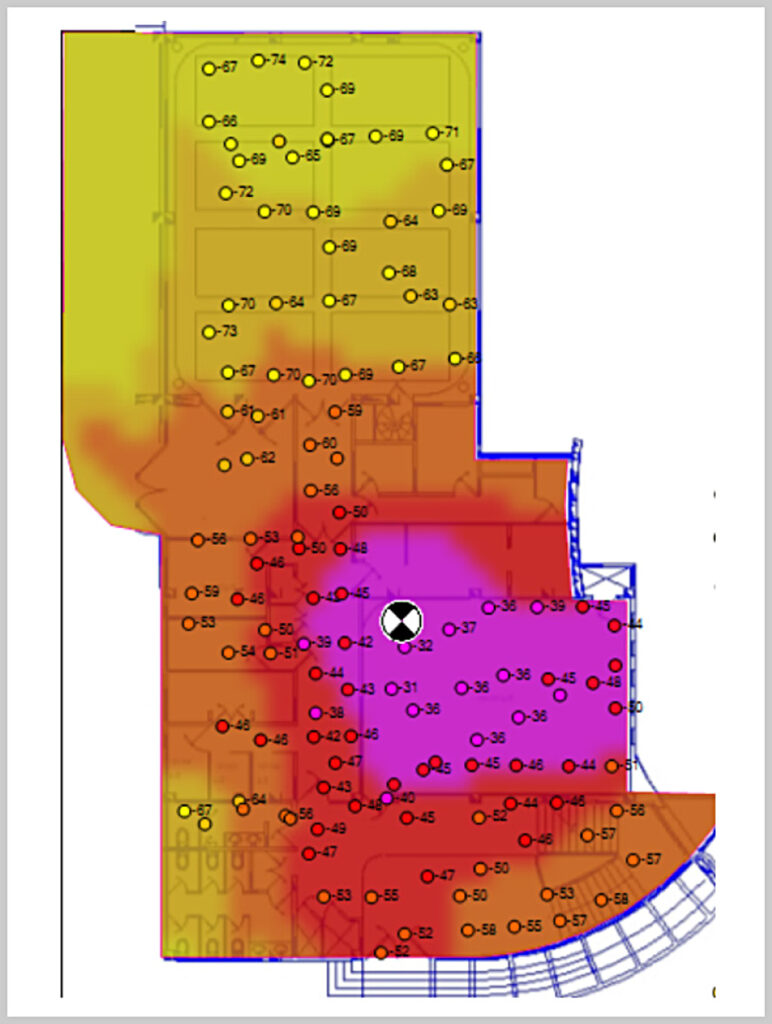
Predicted and measured CW coverage in Building 10, Level 1.
The following table summarizes the prediction accuracy for the building at 850 MHz:
| Prediction vs measured data summary Value (dB) | |
|---|---|
| Mean error (μ) | -3.37 |
| Absolute mean error (μ) | 4.36 |
| Standard deviation (σ) | 4.02 |
Predicted versus measured data:
Building 10, Level 1.
Building 11
On the first level of Building 11, a CW coverage survey at 850 MHz was taken using an omnidirectional antenna located near the center of the oval structure where the faculty offices are. As this is the first level, some survey data was collected just outside the outer walls. The following figure shows the Default FRT coverage prediction superimposed over the CW survey, with Fast Fading averaged out.
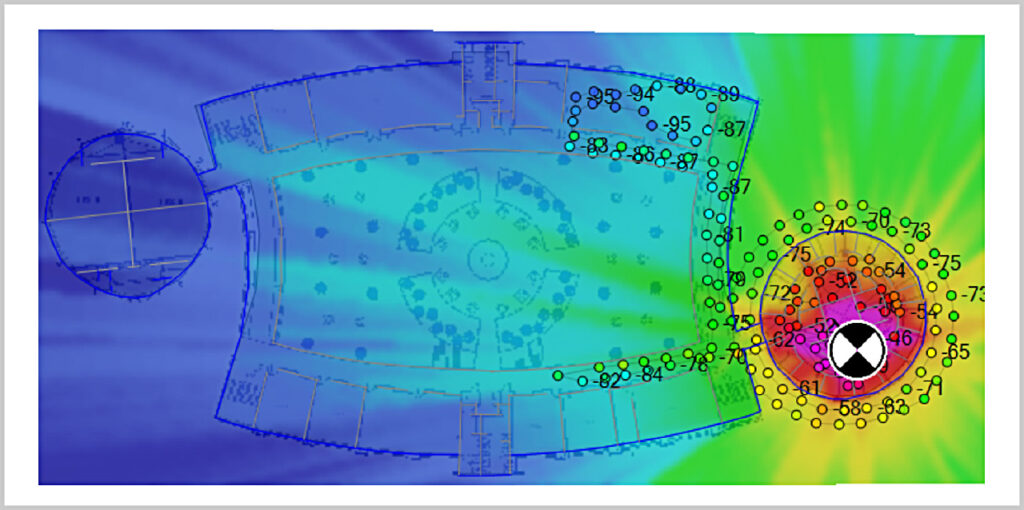
Predicted and measured CW coverage in Building 11, Level 1.
The following table summarizes the prediction accuracy:
| Prediction vs measured data summary Value (dB) | |
|---|---|
| Mean error (μ) | -0.55 |
| Absolute mean error (μ) | 4.25 |
| Standard deviation (σ) | 5.18 |
Predicted versus measured data:
Building 11, Level 1, 850 MHz.
1900 MHz
Building 2
On Level 3 of Building 2, a CW coverage survey at 1900 MHz was taken using a directional antenna located near the center. The following figure shows the default FRT coverage prediction superimposed over the CW survey, with Fast Fading averaged out.
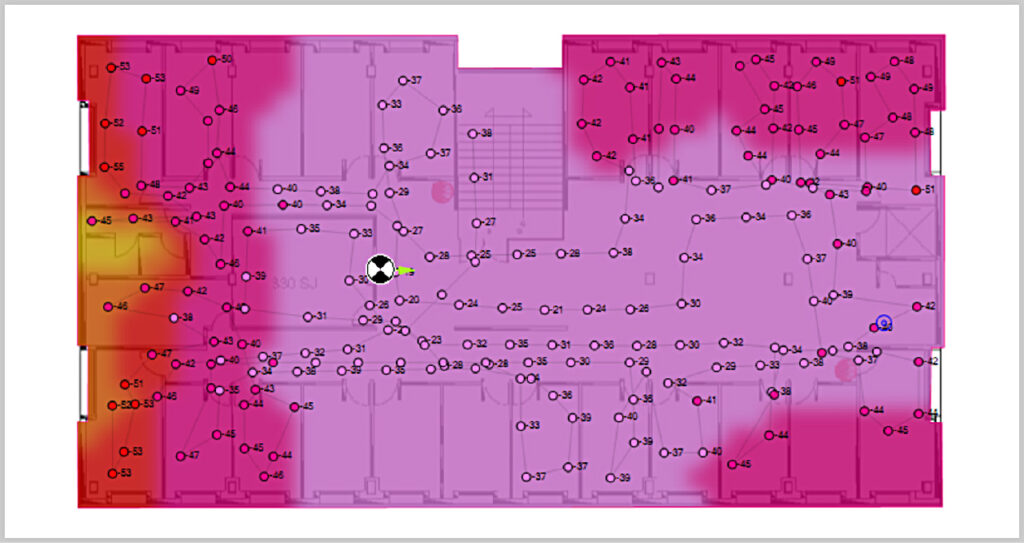
Predicted and measured CW coverage in Building 2, Level 3.
The following table summarizes the prediction accuracy:
| Prediction vs measured data summary Value (dB) | |
|---|---|
| Mean error (μ) | -3.05 |
| Absolute mean error (μ) | 5.51 |
| Standard deviation (σ) | 5.98 |
Predicted versus measured data:
Building 2, Level 3, 1900 MHz.
Building 8
On the first level of Building 8, a CW coverage survey at 1900 MHz was taken using a directional antenna located near the outer wall inside a meeting room. The following figure shows the default FRT coverage prediction superimposed over the CW survey, with Fast Fading averaged out.
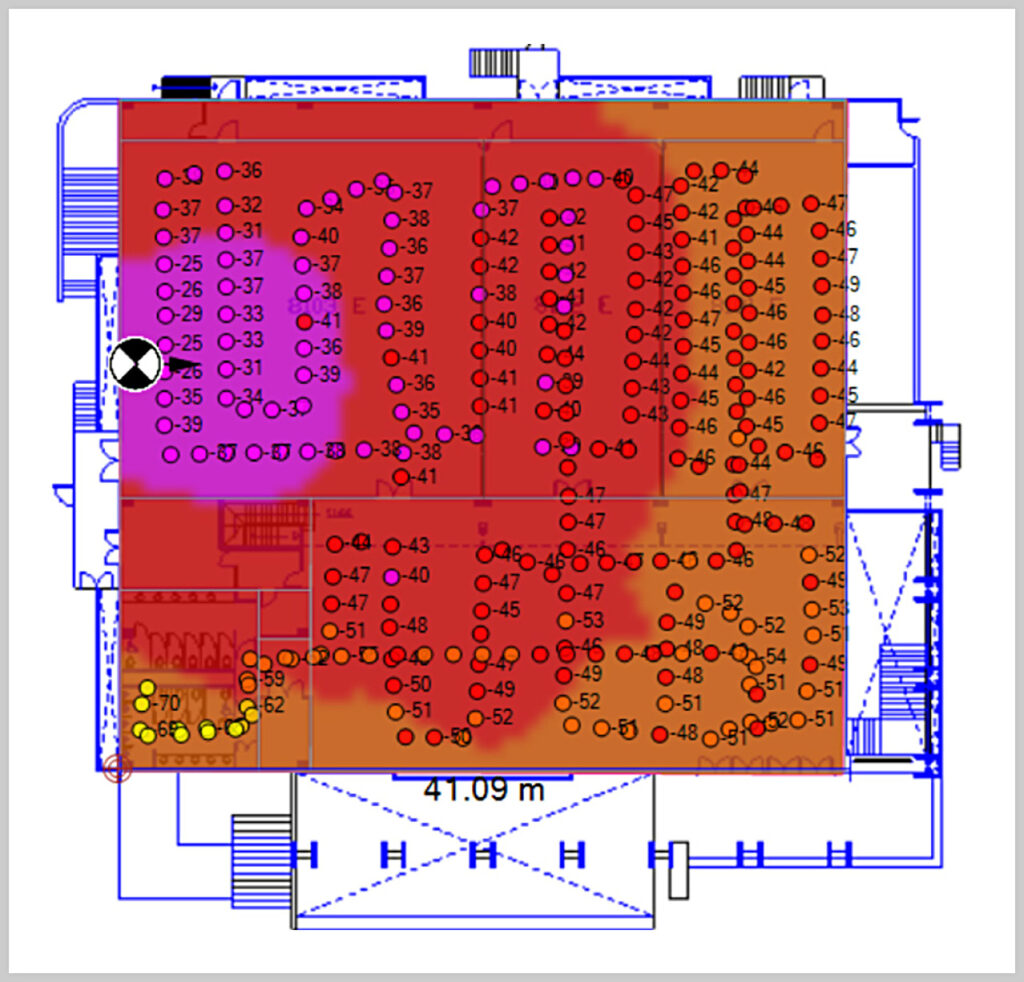
Predicted and measured CW coverage in Building 8, Level 1.
The following table summarizes the prediction accuracy:
| Prediction vs measured data summary Value (dB) | |
|---|---|
| Mean error (μ) | 2.13 |
| Absolute mean error (μ) | 4.82 |
| Standard deviation (σ) | 5.78 |
Predicted versus measured data:
Building 8, Level 1, 1900 MHz.
Building 9
On the third level of Building 9, a CW coverage survey at 1900 MHz was taken at the bottom of the spectators’ seating area. A directional antenna was placed above the last row and pointed down at an angle of 45 degrees. The following figure shows the default FRT coverage prediction superimposed over the CW survey, with Fast Fading removed.
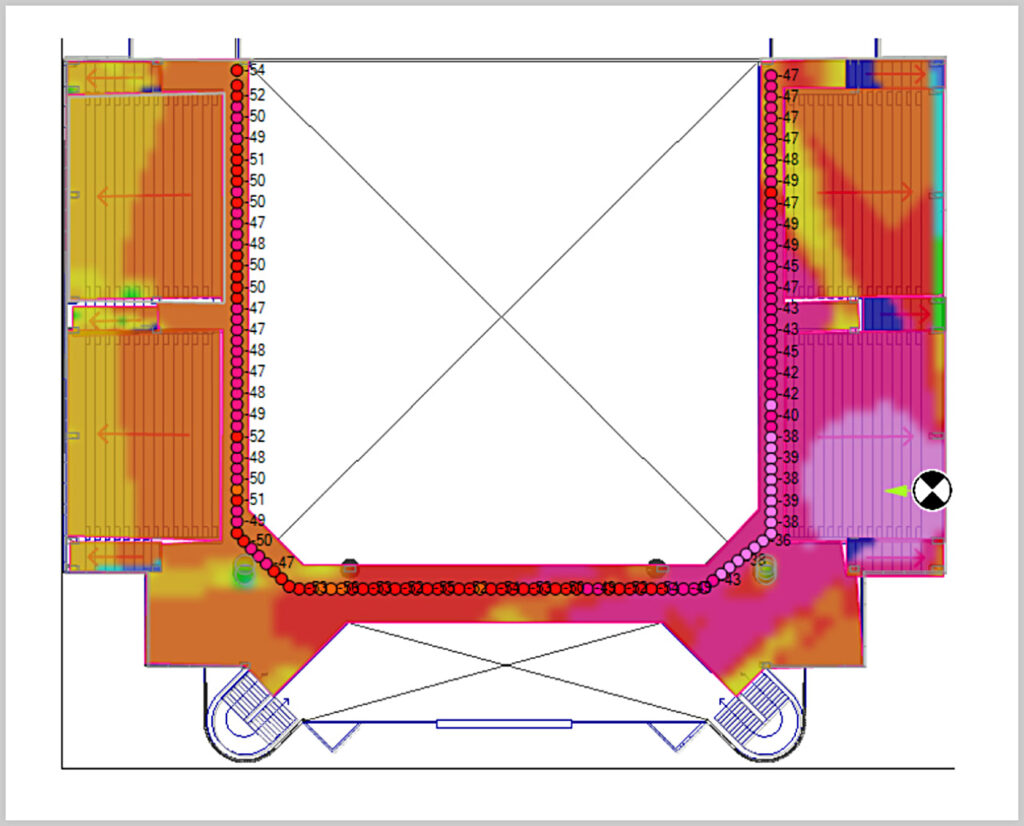
Predicted and measured CW coverage in Building 9, Level 3.
The following table summarizes the prediction accuracy:
| Prediction vs measured data summary Value (dB) | |
|---|---|
| Mean error (μ) | 4.11 |
| Absolute mean error (μ) | 4.85 |
| Standard deviation (σ) | 4.37 |
Predicted versus measured data:
Building 9, Level 3, 1900 MHz.
Building 10
On the second level of Building 10, a CW coverage survey at 1900 MHz was taken using a directional antenna in a hallway near the center of the floorplan. The following figure shows the default FRT coverage prediction superimposed over the CW survey, with Fast Fading removed:
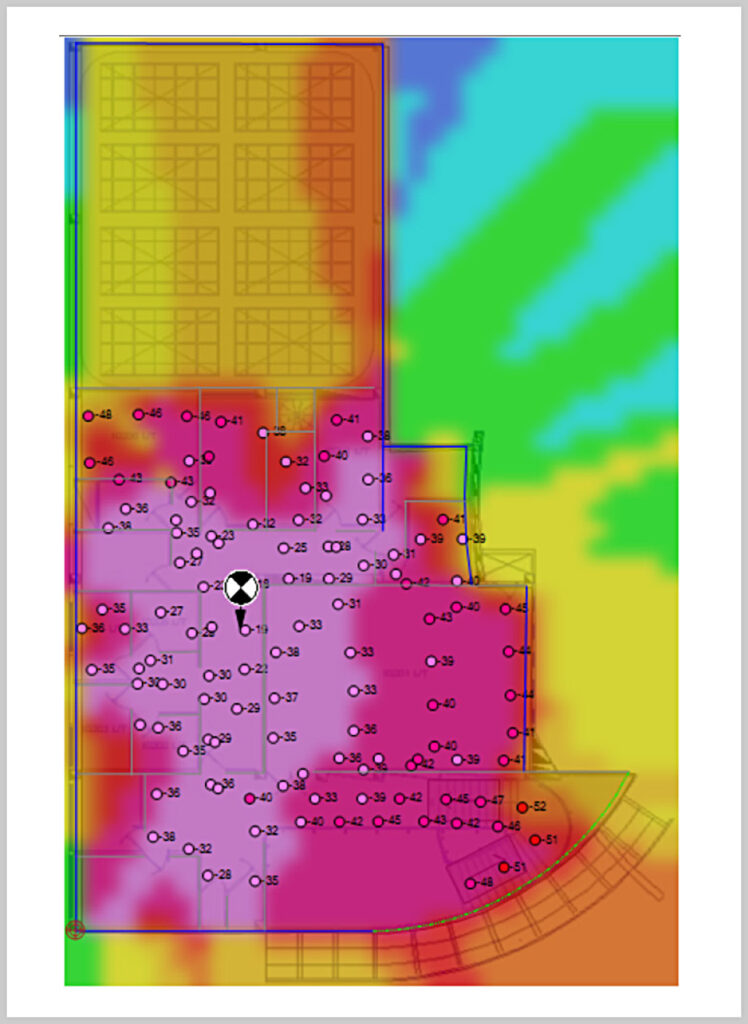
Predicted and measured CW coverage in Building 10, Level 2.
The following table summarizes the prediction accuracy:
| Prediction vs measured data summary Value (dB) | |
|---|---|
| Mean error (μ) | 3.42 |
| Absolute mean error (μ) | 5.19 |
| Standard deviation (σ) | 6.40 |
Predicted versus measured data:
Building 10, Level 2, 1900 MHz.
Building 11
On the second level of Building 11, a CW coverage survey at 1900 MHz was taken using a directional antenna located near the center of the oval structure where the faculty offices are. The following figure shows the default FRT coverage prediction superimposed over the CW survey, with Fast Fading removed:
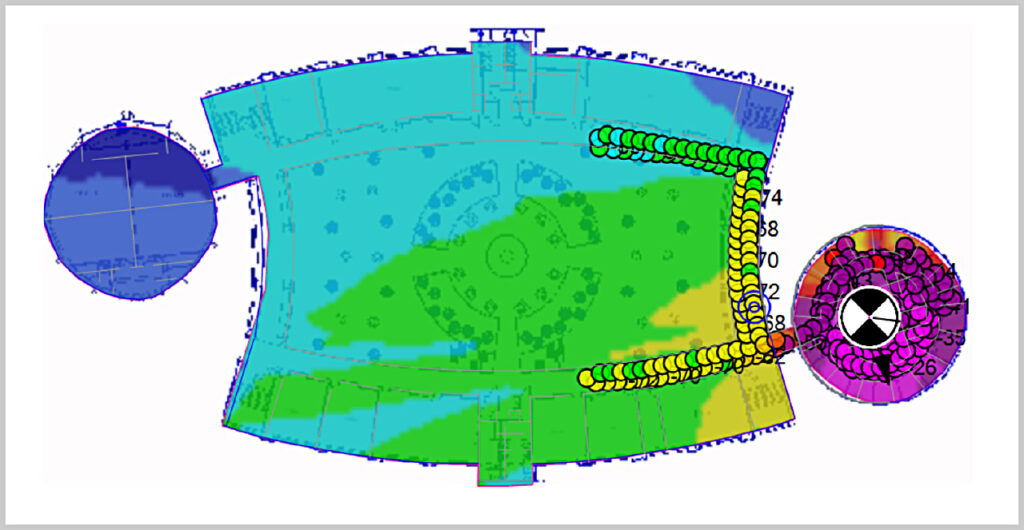
Predicted and measured CW coverage in Building 11, Level 2.
The following table summarizes the prediction accuracy:
| Prediction vs measured data summary Value (dB) | |
|---|---|
| Mean error (μ) | 3.54 |
| Absolute mean error (μ) | 4.85 |
| Standard deviation (σ) | 4.90 |
Predicted versus measured data:
Building 11, Level 2, 1900 MHz.
2100 MHz
Bell Center (NHL Arena)
In the following figures, we present CW survey data and default FRT coverage prediction maps in the NHL arena. Figure 45 displays CW measurements and the default FRT coverage prediction at Level 2B.
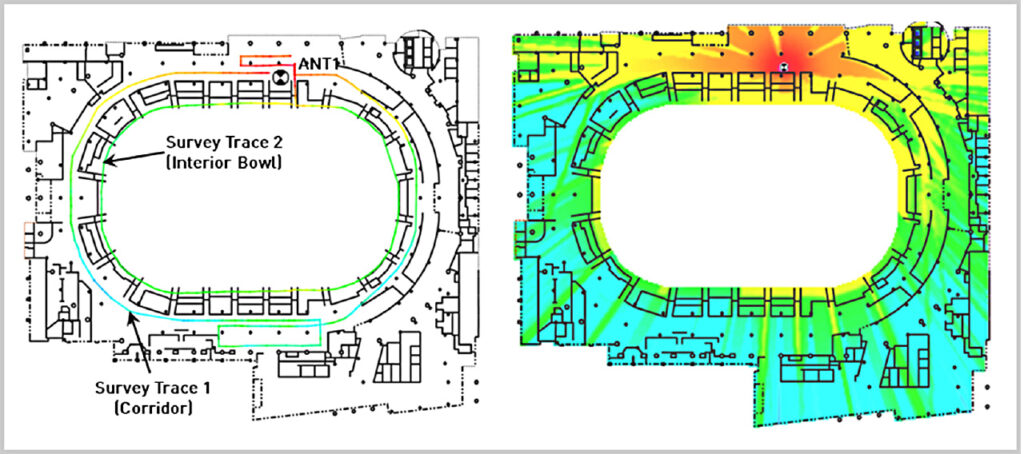
Default FRT coverage prediction and survey traces for Antenna 1 at Level 2B.
CW measurements and the default FRT coverage prediction on Level 2, originating from an antenna located on the same level, are shown in Figure 46.
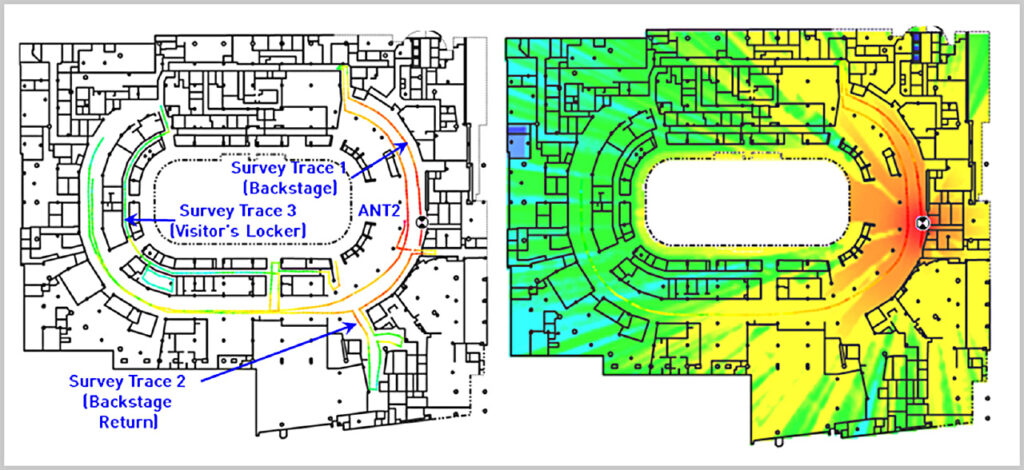
Default FRT coverage prediction and CW survey traces for Antenna 2 at Level 2.
CW measurements and the default FRT coverage map of Level 2B, derived from Antenna 3 located on Level 7, are shown in Figure 47.
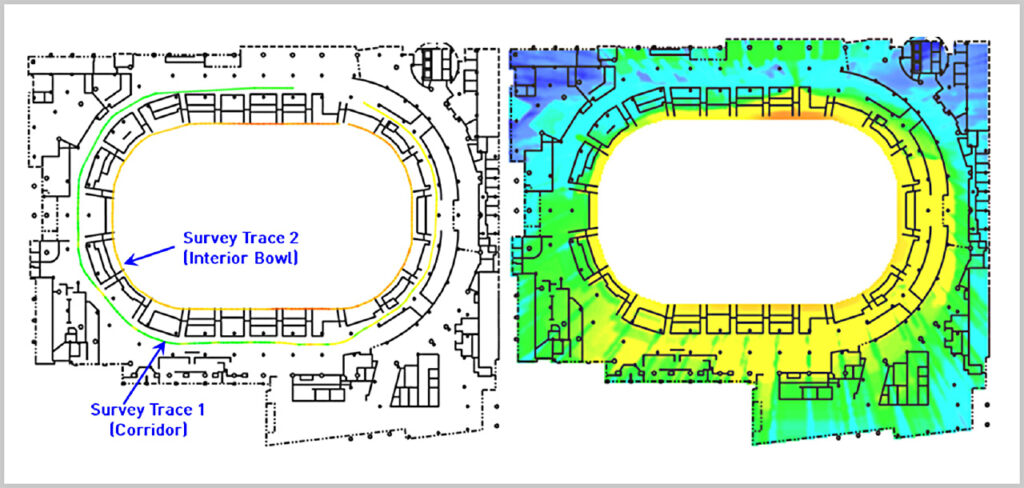
FRT prediction and survey traces for Level 2B with Antenna 3 on Level 7.
The following table summarizes the prediction accuracy at the arena (2100 MHz):
| MEAN ERROR | ABS MEAN ERROR | STD DEV | ||
|---|---|---|---|---|
| Antenna 1 | Interior Bowl | -2.7 | 4.65 | 4.88 |
| Corridor | -0.63 | 4.66 | 5.54 | |
| Antenna 2 | Backstage | 3.07 | 4.95 | 5.53 |
| Backstage Return | 1.66 | 4.57 | 5.42 | |
| Visitors’ Locker Room | -0.95 | 4.28 | 5.15 | |
| Interior Bowl | -2.28 | 4.19 | 4.98 | |
| Antenna 3 | Interior Bowl | 1.8 | 4.3 | 5.47 |
| Corridor | 0.55 | 5.64 | 6.7 |
Results for NHL Arena.
Rockland Center
In the following figures, we present CW measurements and the default FRT coverage prediction at Rockland Center. Figure 48 displays the results of the prediction and survey traces for Antenna 1 at Level 2.
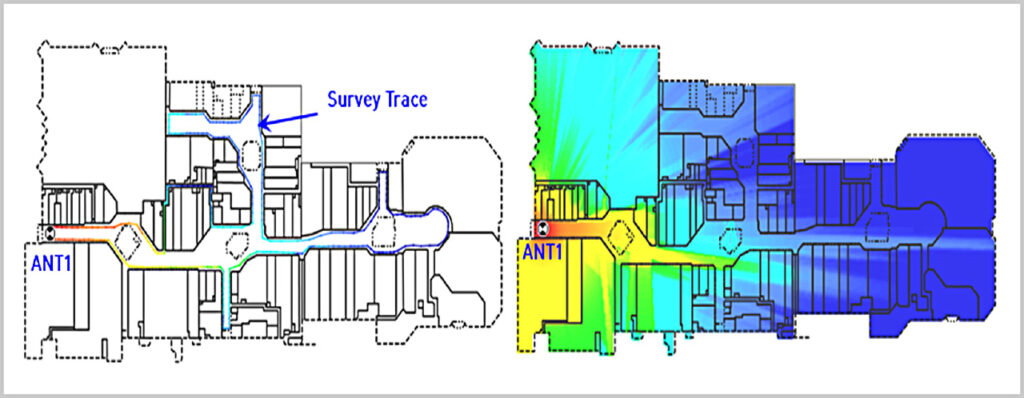
Default prediction and survey trace for Antenna 1 at Level 2.
The results of default FRT prediction and CW survey traces for Antenna 3 on level 2 are shown in Figure 49.
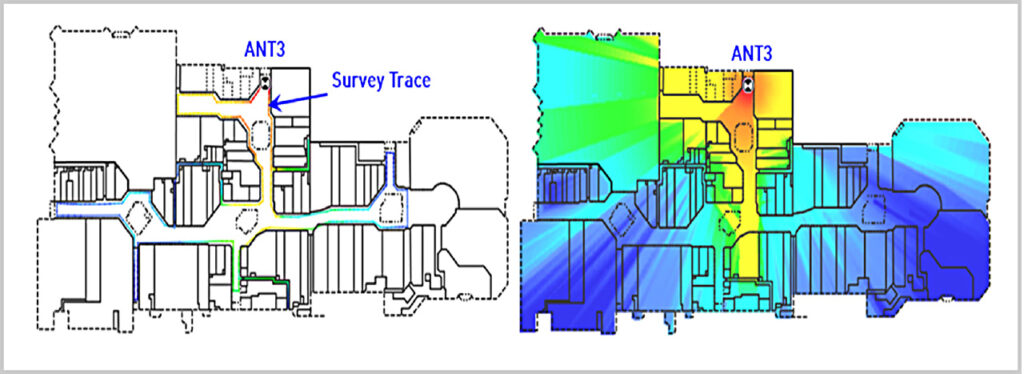
Default FRT prediction and survey traces for Antenna 3 on Level 1.
For Antenna 4, Figure 50 shows the default prediction and the survey traces.
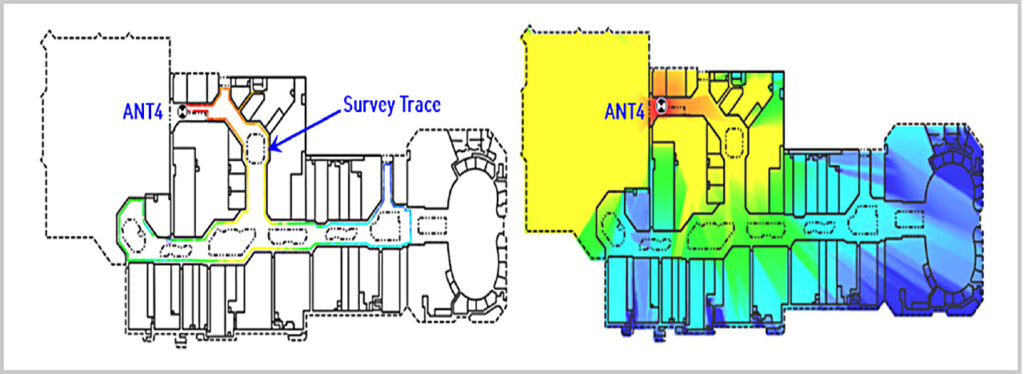
Default FRT Prediction and CW survey Traces for Antenna 4 on Level 1.
Finally, the default prediction and the survey traces on Level 3 for Antenna 5 are shown in Figure 51 on Level 3.
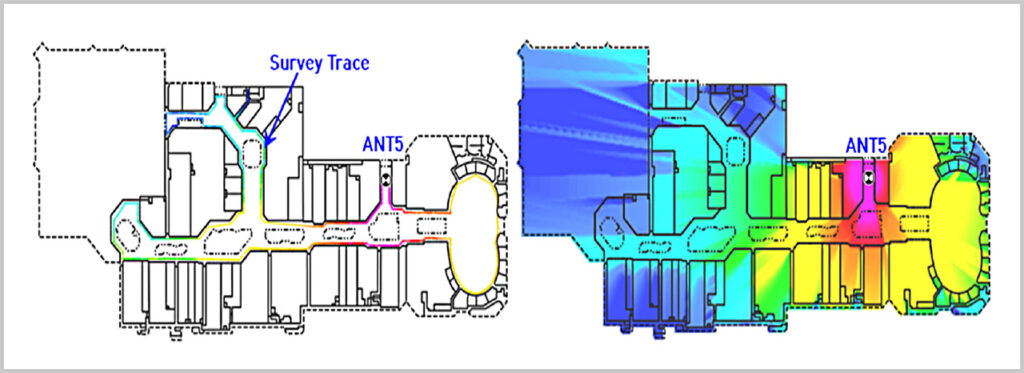
Default FRT prediction and CW survey traces for Antenna 5, on Level 3.
The following table summarizes prediction accuracy at the mall (2100 MHz).
| MEAN ERROR | ABS MEAN ERROR | STD DEV | ||
|---|---|---|---|---|
| Antenna 1 | Level 2 | 1.62 | 4.79 | 5.55 |
| Antenna 3 | Level 2 | 1.49 | 4.77 | 5.56 |
| Antenna 4 | Level 3 | 3.55 | 5.62 | 5.63 |
| Antenna 5 | Level 3 | 7.37 | 7.95 | 5.36 |
Results for Shopping Mall.
iBwave HQ Office
In the following figures, we present CW measurements and the default coverage prediction at iBwave HQ. Figure 52 displays the CW measurements and the coverage prediction for Antenna 1.
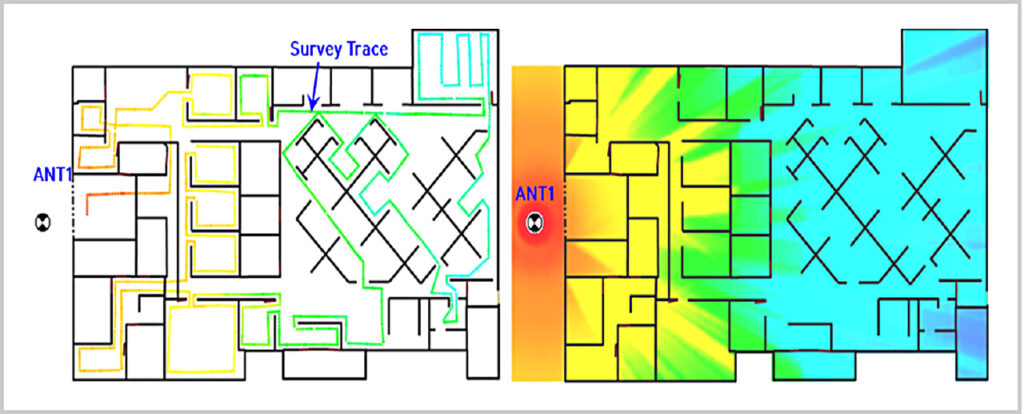
Default FRT coverage and CW survey trace for Antenna 1.
CW measurements and Default FRT coverage map for antenna 2 are shown in Figure 53.
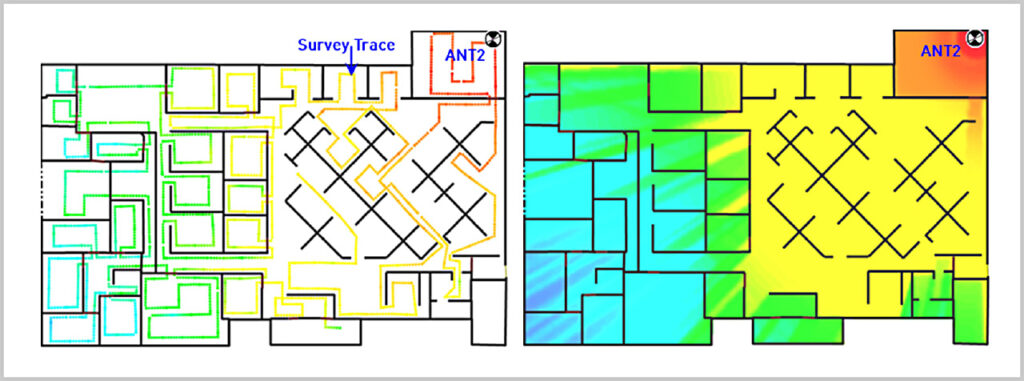
Default FRT coverage and CW survey trace for Antenna 2.
For antenna 3, CW measurements and default FRT coverage map are shown in Figure 54.
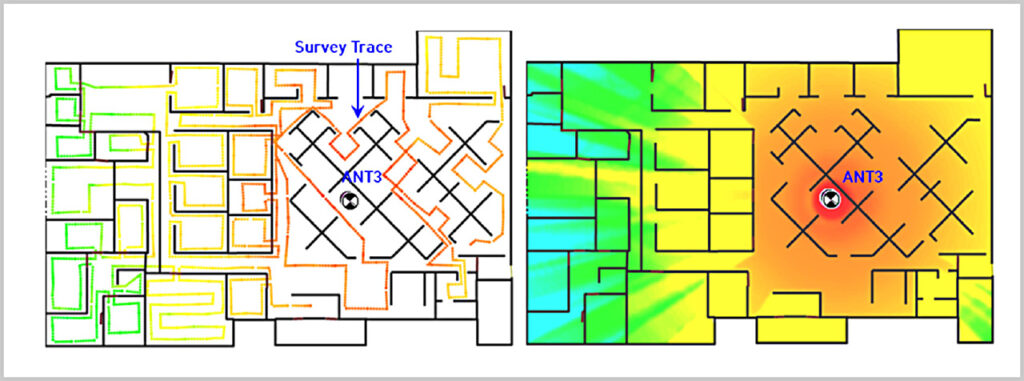
Default FRT coverage and CW survey trace for Antenna 3.
Finally, CW measurements and default FRT coverage map for Antenna 4 are shown in Figure 55.
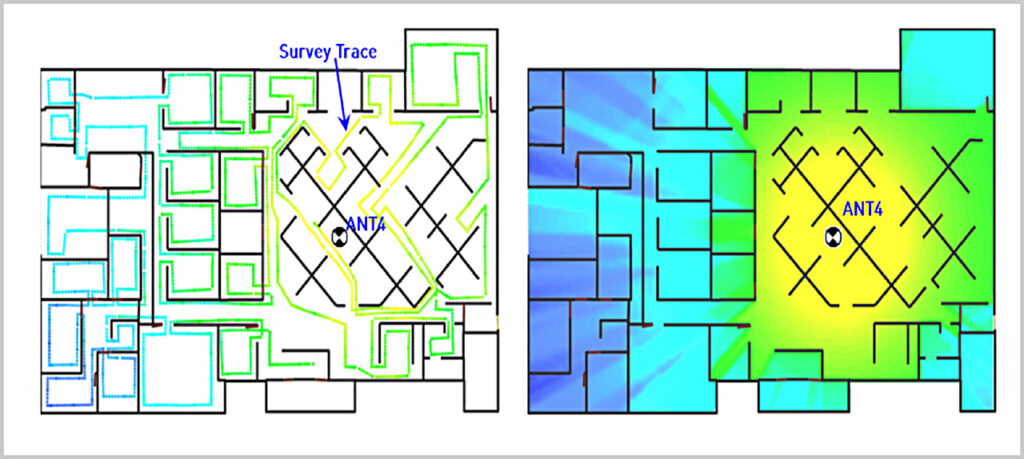
Default FRT coverage and CW survey trace for Antenna 4.
The following table summarizes the prediction accuracy at the office (2100 MHz):
| MEAN ERROR | ABS MEAN ERROR | STD DEV | |
|---|---|---|---|
| Antenna 1 | 6.61 | 6.67 | 3.2 |
| Antenna 3 | 4.75 | 5.08 | 3.4 |
| Antenna 4 | 4.3 | 4.82 | 3.93 |
| Antenna 5 | 4.55 | 5.28 | 4.72 |
Prediction versus measured data:
Old iBwave HQ.
2400 MHz
Building 2
On the second Level of Building 2, a CW coverage survey at 2400 MHz was conducted using a directional antenna positioned at the end of a long hallway connecting various laboratories. Figure 56 displays the default FRT coverage prediction superimposed over the CW survey, with Fast Fading averaged out.
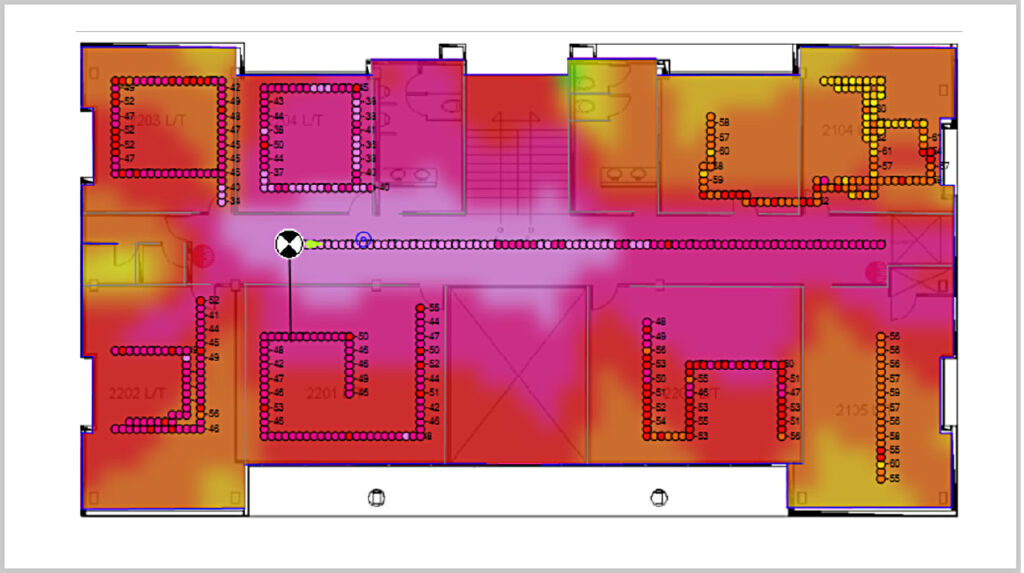
Predicted and measured CW coverage at 2400 MHz in Building 2, Level 2.
The following table summarizes the prediction accuracy:
| Prediction vs measured data summary Value (dB) | |
|---|---|
| Mean error (μ) | 2.33 |
| Absolute mean error (μ) | 4.77 |
| Standard deviation (σ) | 5.64 |
Predicted versus measured data:
Building 2, Level 2, 2400 MHz.
Building 9
On the third level of Building 9, a CW coverage survey at 2400 MHz was taken at the bottom of the spectators’ seating area. A directional antenna was placed above the last row of seats and was pointing down at an angle of 45 degrees. The following figure shows the default FRT coverage prediction superimposed over the CW survey, with Fast Fading removed.
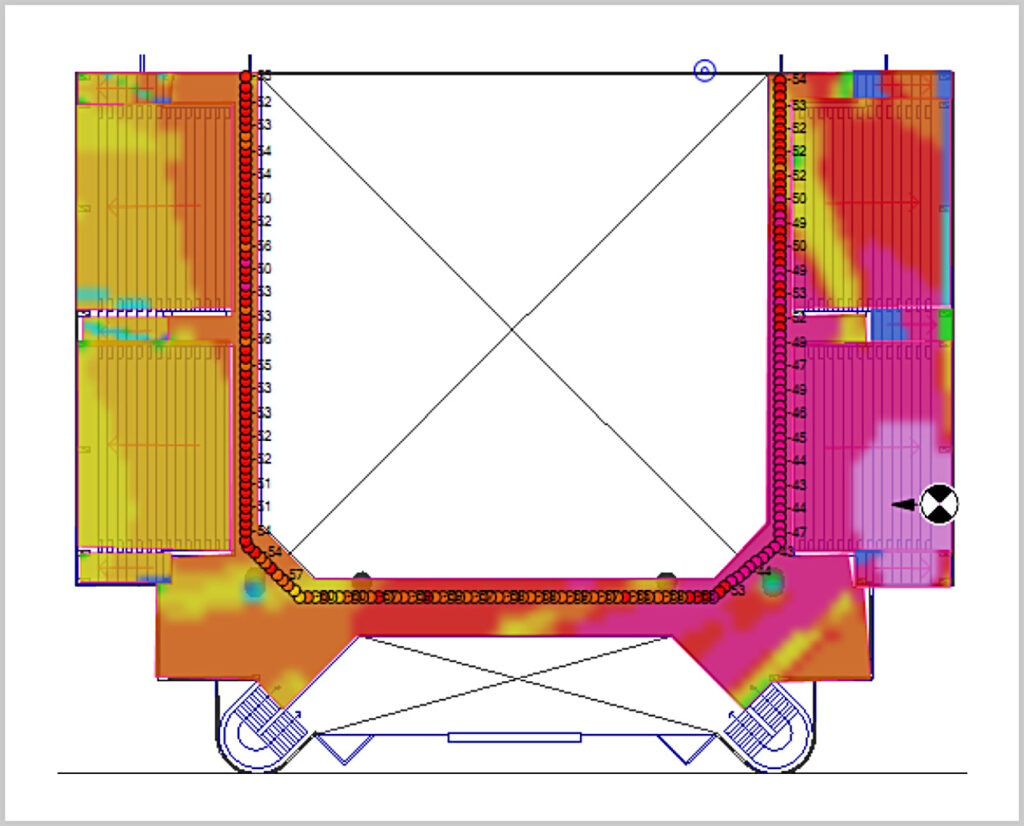
Predicted and measured CW coverage at 2400 MHz in Building 9, Level 3.
The following table summarizes the prediction accuracy:
| Prediction vs measured data summary Value (dB) | |
|---|---|
| Mean error (μ) | 0.73 |
| Absolute mean error (μ) | 4.00 |
| Standard deviation (σ) | 4.88 |
Predicted versus measured data:
Building 9, Level 3, 2400 MHz.
Building 10
On the second Level of Building 10, a CW coverage survey at 2400 MHz was performed using a directional antenna located at the center. Figure 58 illustrates the default FRT coverage prediction superimposed over the CW survey, with Fast Fading averaged out.
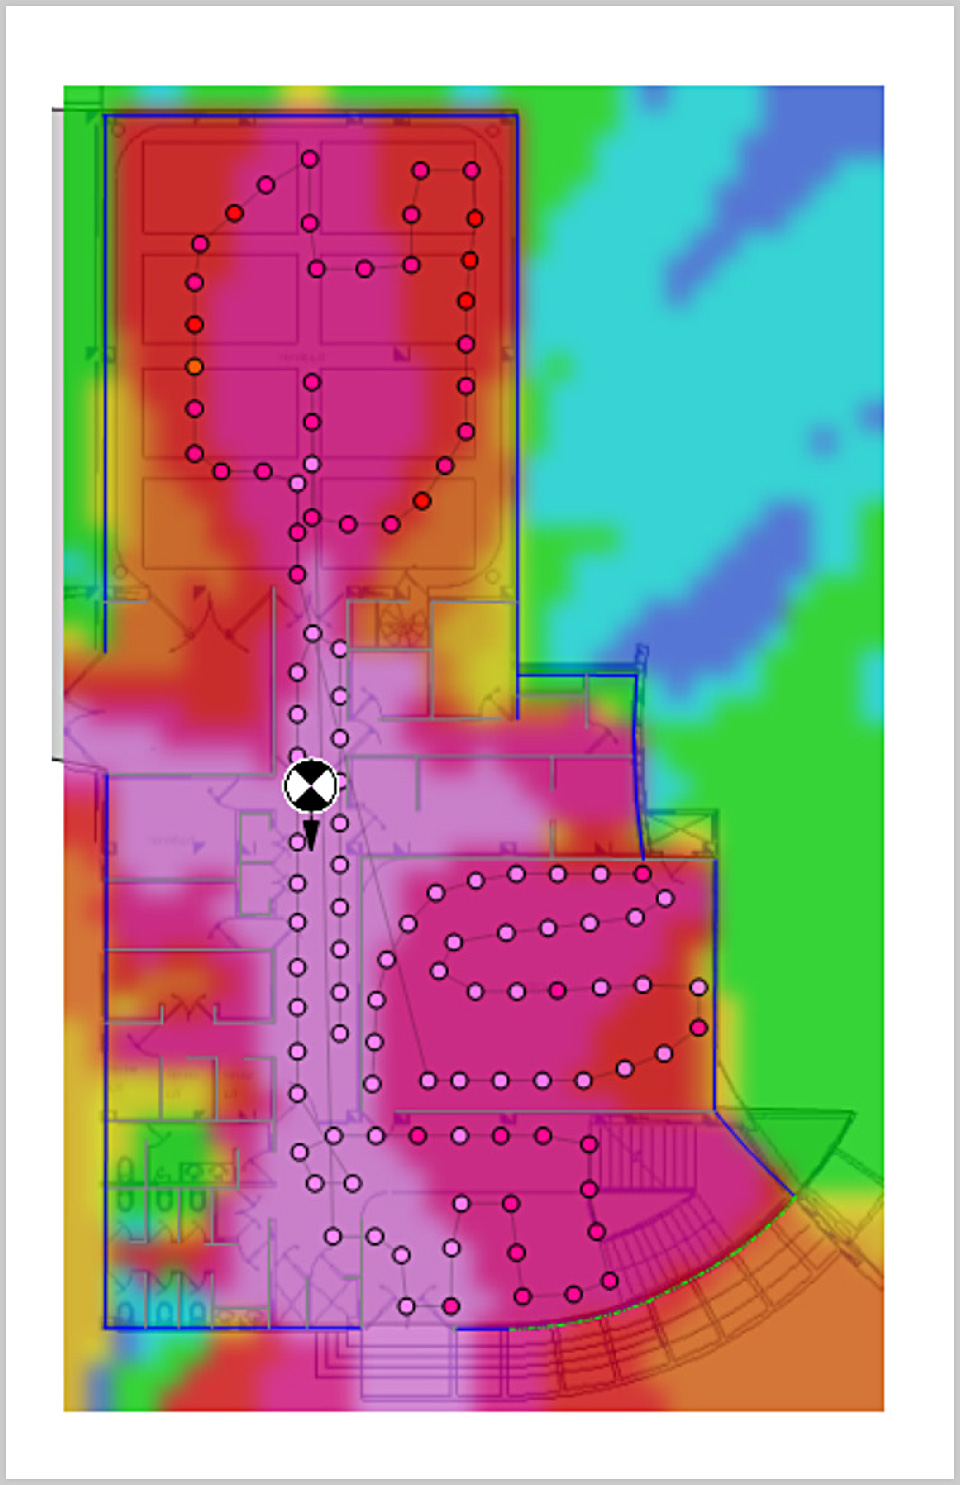
Predicted and measured CW coverage at 2400 MHz in Building 10, Level 2.
The following table summarizes the prediction accuracy:
| Prediction vs measured data summary Value (dB) | |
|---|---|
| Mean error (μ) | 4.40 |
| Absolute mean error (μ) | 5.31 |
| Standard deviation (σ) | 5.05 |
Predicted versus measured data:
Building 10, Level 2, 2400 MHz.
3200 MHz
Building 9
On the second Level of Building 9, CW coverage surveys were performed at 3200 MHz using omnidirectional antennas. Figure 59 illustrates the default FRT coverage prediction superimposed over the CW survey for Antenna 5, with Fast Fading averaged out.
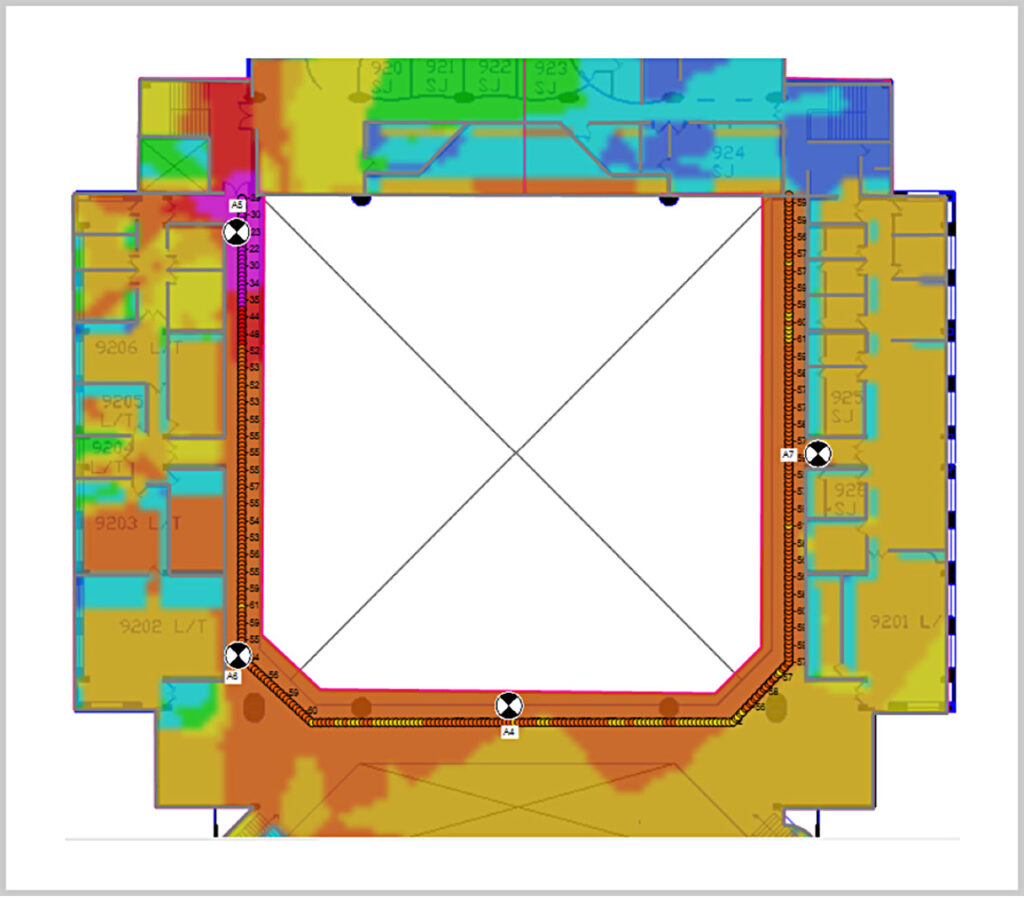
Predicted & measured CW coverage, Antenna 5.
Figure 60 illustrates the default FRT coverage prediction superimposed over the CW survey for Antenna 6, with fast fading averaged out.
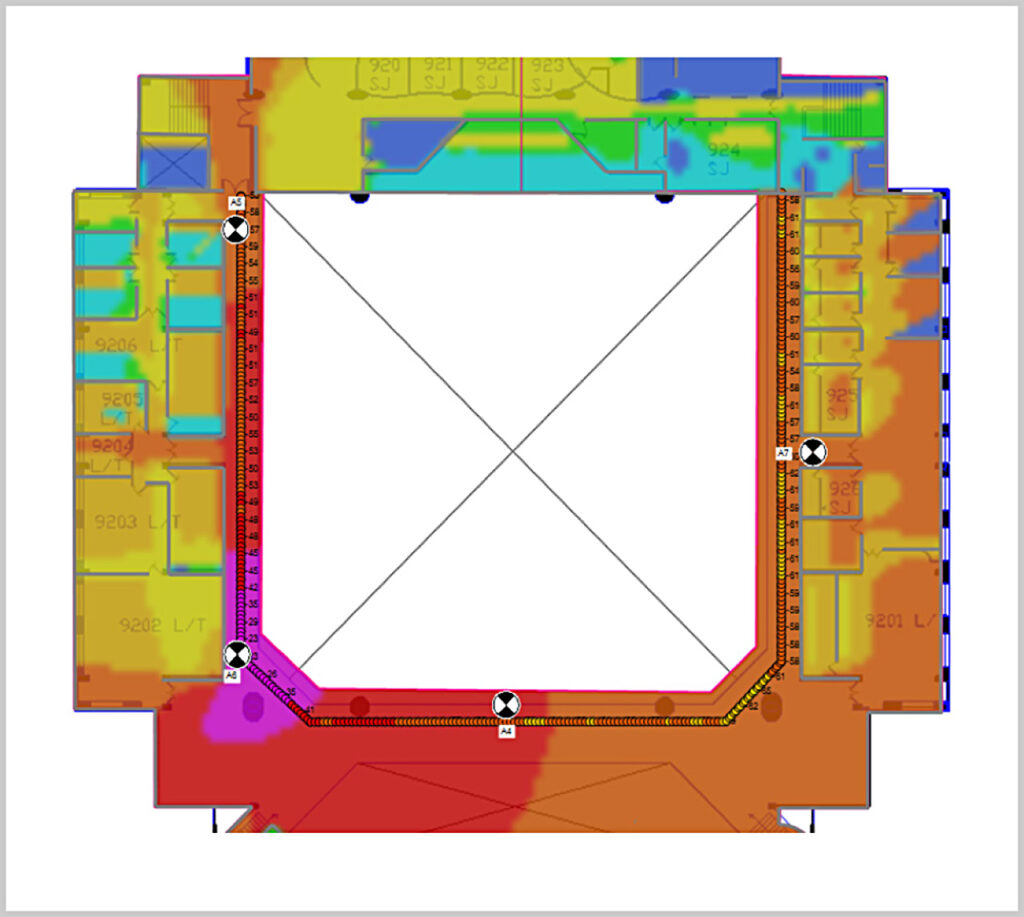
Predicted & measured CW coverage, Antenna 6.
Figure 61 illustrates the default FRT coverage prediction superimposed over the CW survey for Antenna 4, with fast fading averaged out.
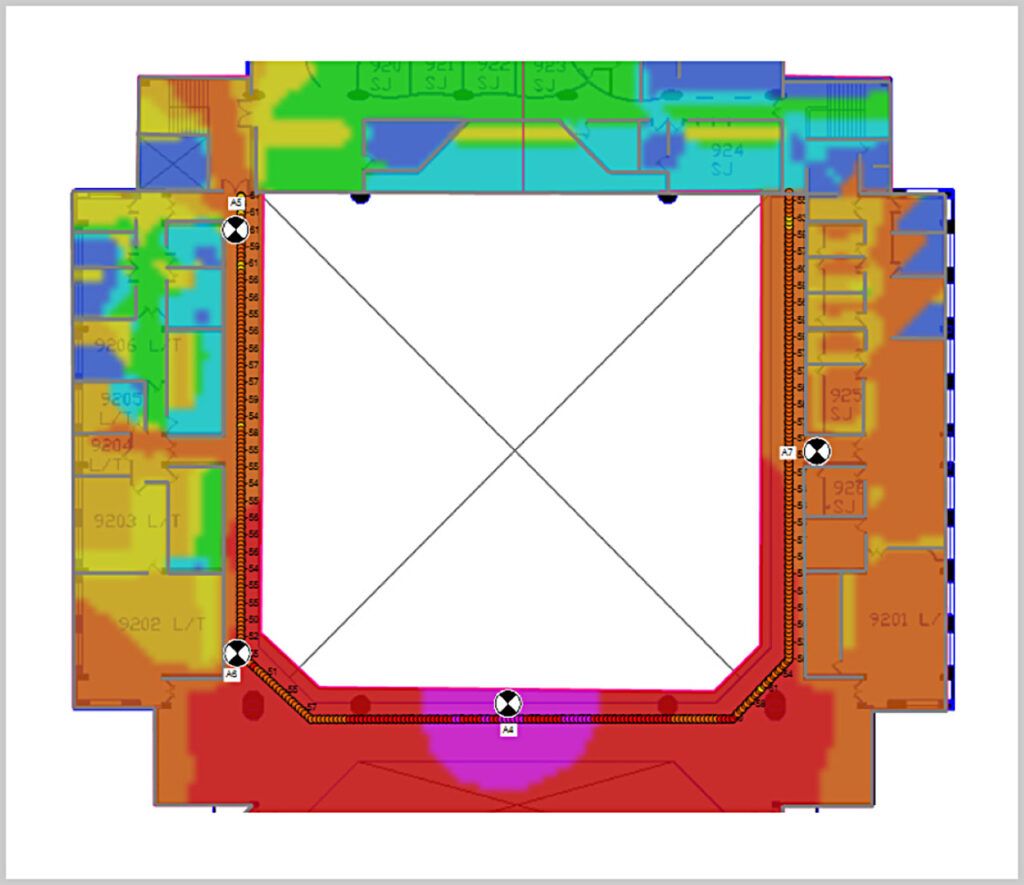
Predicted & measured CW coverage, Antenna 4.
Figure 62 illustrates the default FRT coverage prediction superimposed over the CW survey for Antenna 7, with Fast Fading averaged out.
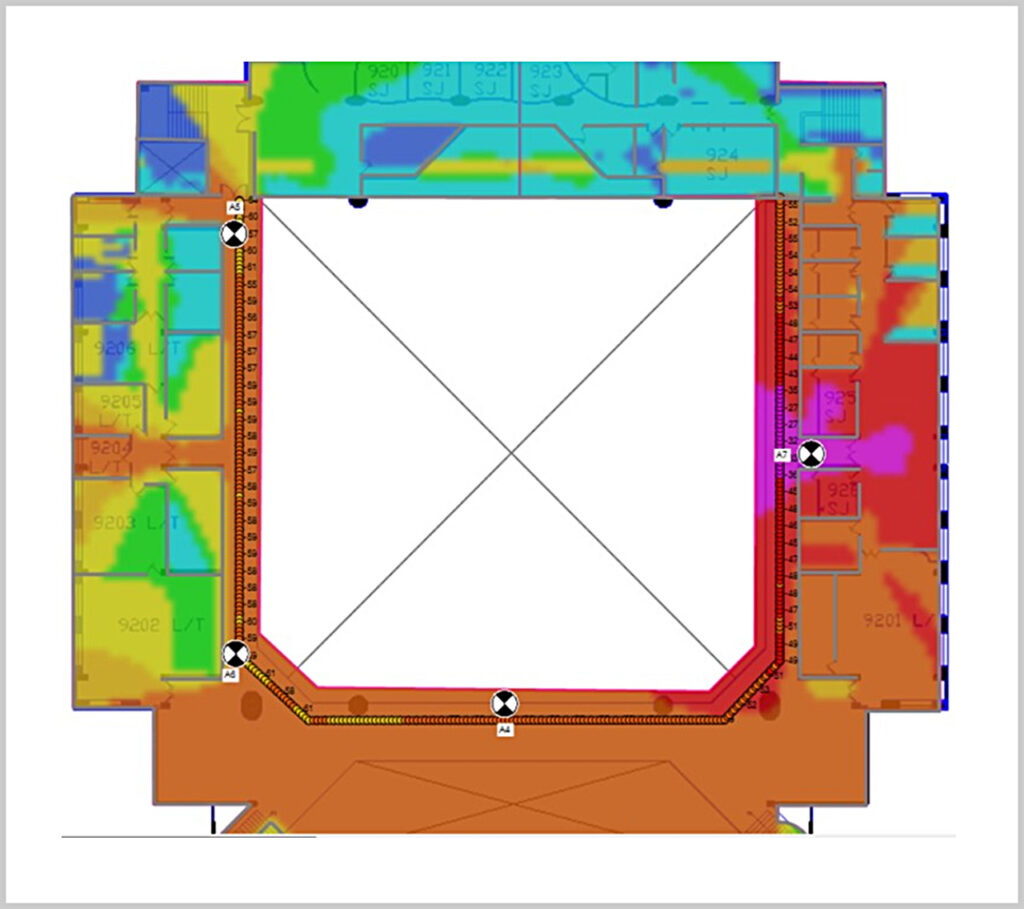
Predicted & measured CW coverage, Antenna 7.
Error statistics for the four antennas are summarized in the table below:
| MEAN ERROR | ABS MEAN ERROR | STD DEV | |
|---|---|---|---|
| Antenna 5 | -3.8 | 4.37 | 3.30 |
| Antenna 6 | -4.8 | 5.45 | 3.84 |
| Antenna 4 | -5.54 | 5.54 | 2.36 |
| Antenna 7 | -3.54 | 4.13 | 3.24 |
Prediction versus measured data:
Building 9, 3200 MHz.
3500 MHz
Bossa Nova Mall
Unlike the previous venues, the survey at Bossa Nova Mall was conducted using a 5G NR network at this frequency. The survey antenna was situated near the center of the food court, on the mezzanine level in Rio de Janeiro. Figure 63 demonstrates the FRT 5G NR SS-RSRP coverage prediction superimposed over the 5G NR survey, with Fast Fading removed by averaging the signal over 20 wavelengths.
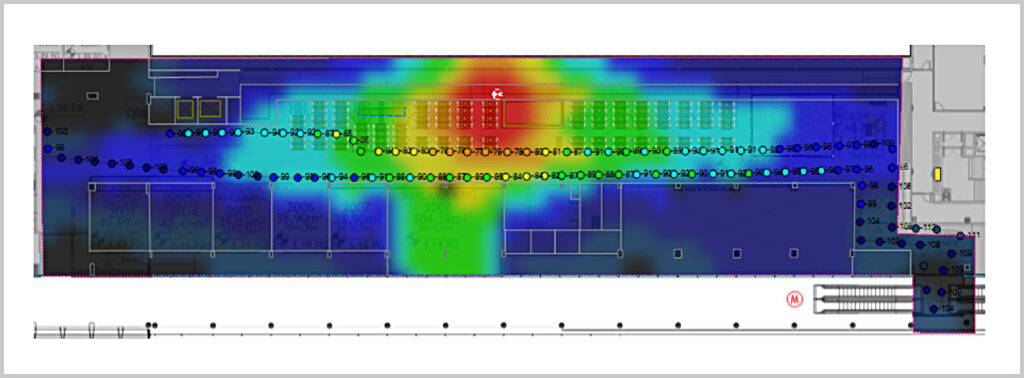
Predicted and measured 5G NR coverage at Bossa Nova Mall.
The following table summarizes the prediction accuracy:
| Prediction vs measured data summary Value (dB) | |
|---|---|
| Mean error (μ) | 1.46 |
| Absolute mean error (μ) | 4.04 |
| Standard deviation (σ) | 5.36 |
Predicted versus measured data:
Food court at Bossa Nova Mall.
28 GHz
Consultix Office
In the next few figures, we present the default FRT coverage prediction and the CW survey at Consultix office. There are four antenna locations for this survey, and for antenna 1, the survey and the coverage prediction are shown with Fast Fading averaged out.
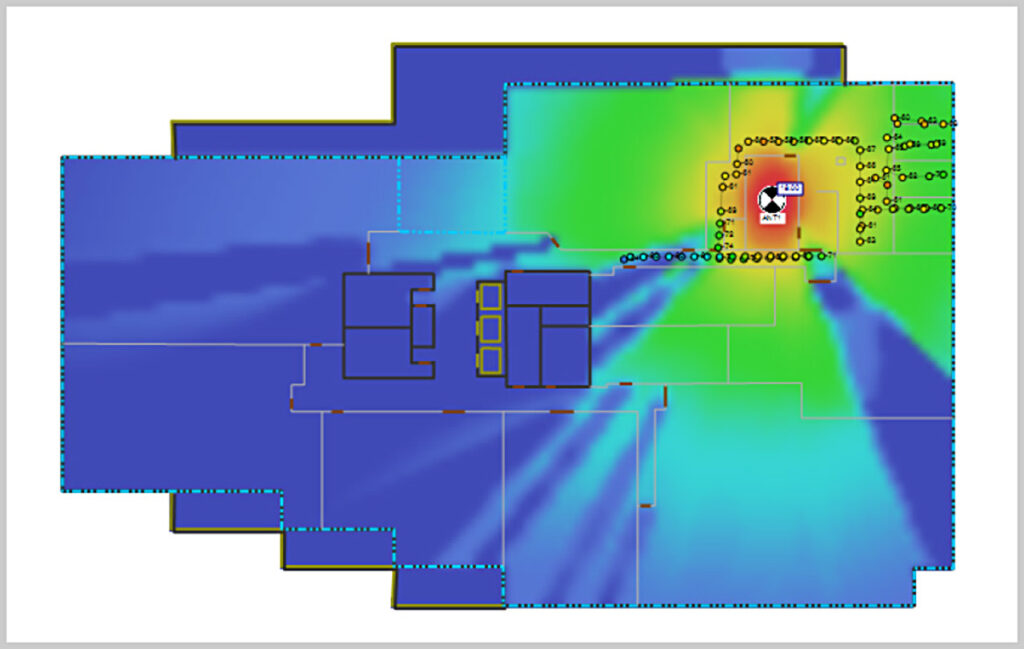
Predicted and measured CW coverage for Antenna 1.
For Antenna 2, the survey and the coverage prediction are shown with Fast Fading averaged out.
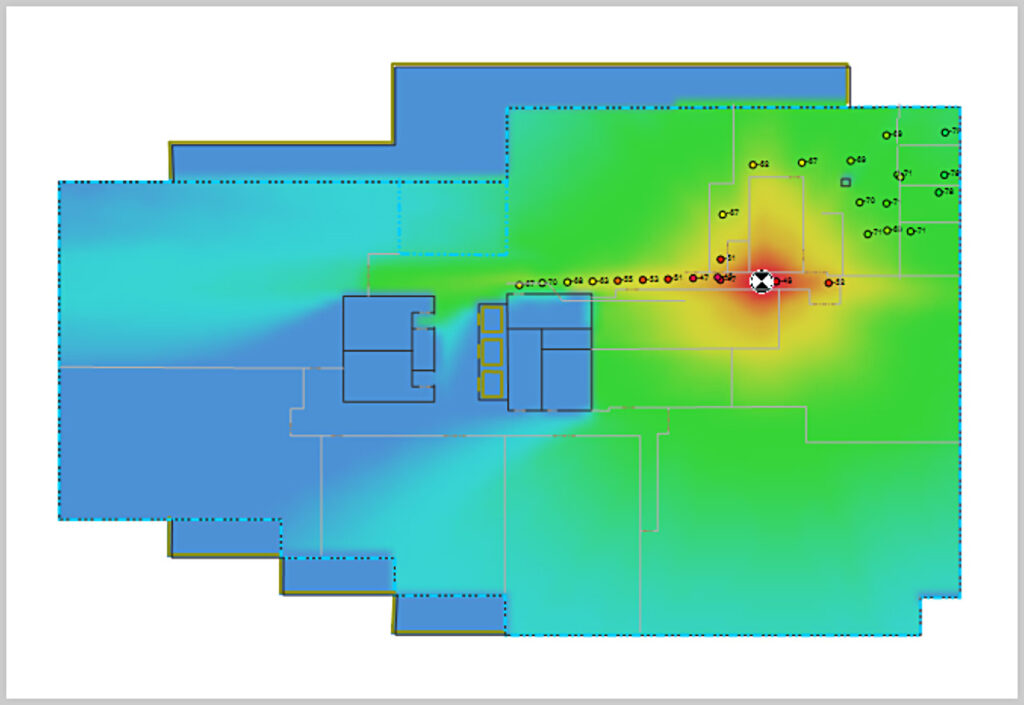
Predicted and measured CW coverage for Antenna 2.
For Antenna 3, the survey and the coverage prediction are shown in the following figure with Fast Fading averaged out.
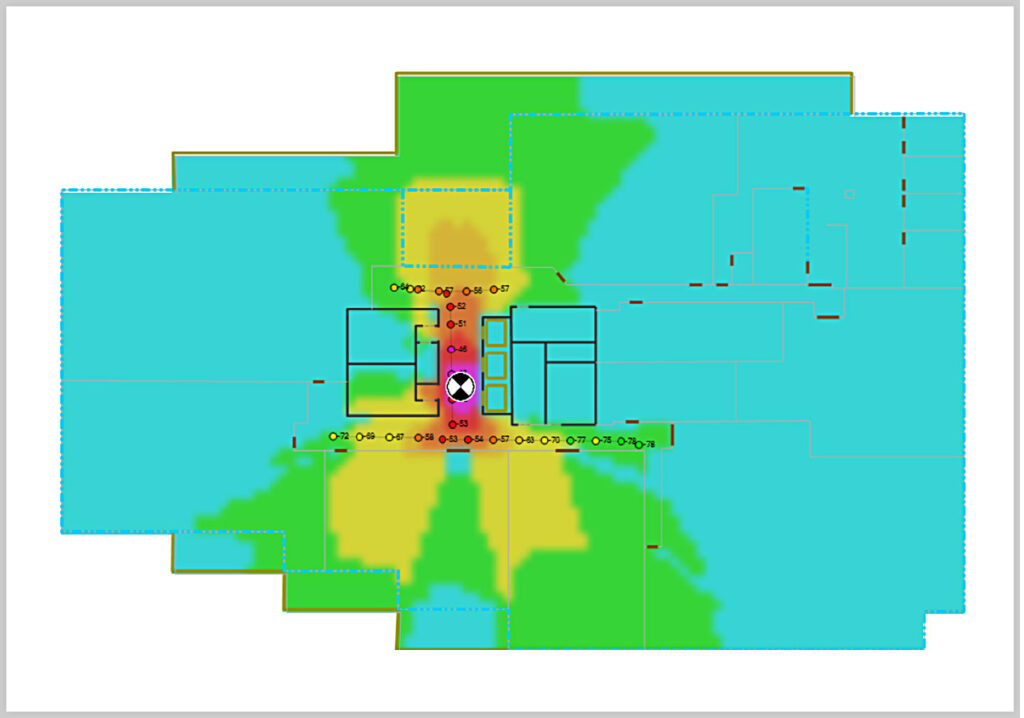
Predicted and measured CW coverage for Antenna 3.
For Antenna 4, the survey and the coverage prediction are shown in the following figure with Fast Fading averaged out.
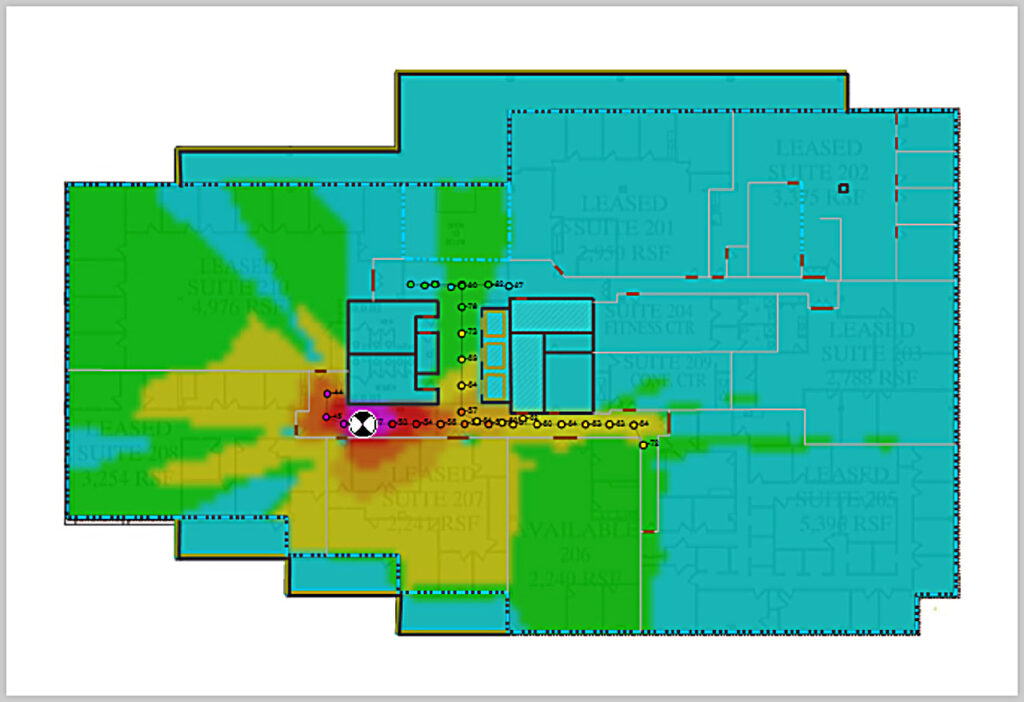
Predicted and measured CW coverage for Antenna 4.
The following table summarizes the prediction accuracy:
| MEAN ERROR | ABS MEAN ERROR | STD DEV | |
|---|---|---|---|
| Antenna 1 | 2.18 | 4.90 | 5.68 |
| Antenna 2 | 3.74 | 4.33 | 4.28 |
| Antenna 3 | 4.59 | 4.91 | 4.17 |
| Antenna 4 | 3.78 | 4.53 | 3.90 |
Prediction versus measured data:
Consultix Office at 28 GHz.
Data Analysis
An overview of the default prediction accuracy is shown below. The difference between the prediction and measurement is the prediction error, and the error statistics are presented in the next three figures across all frequencies and venues:
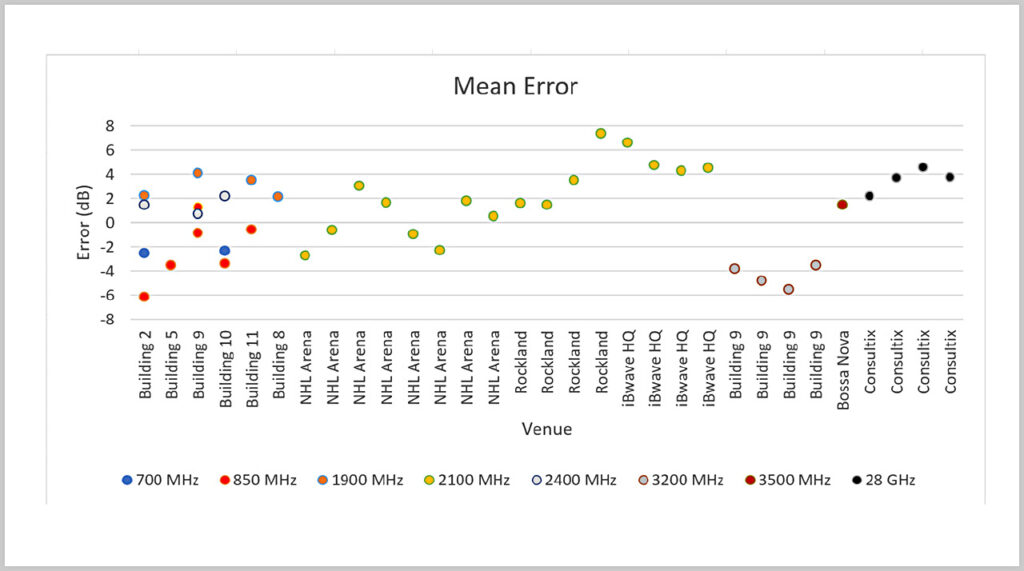
Prediction error mean error for all surveys.
Most (37 out of 40) mean error values are in the -4 to 5 dB range. This implies that the probability that the prediction mean error is in this range is greater than 90%, regardless of the frequency.
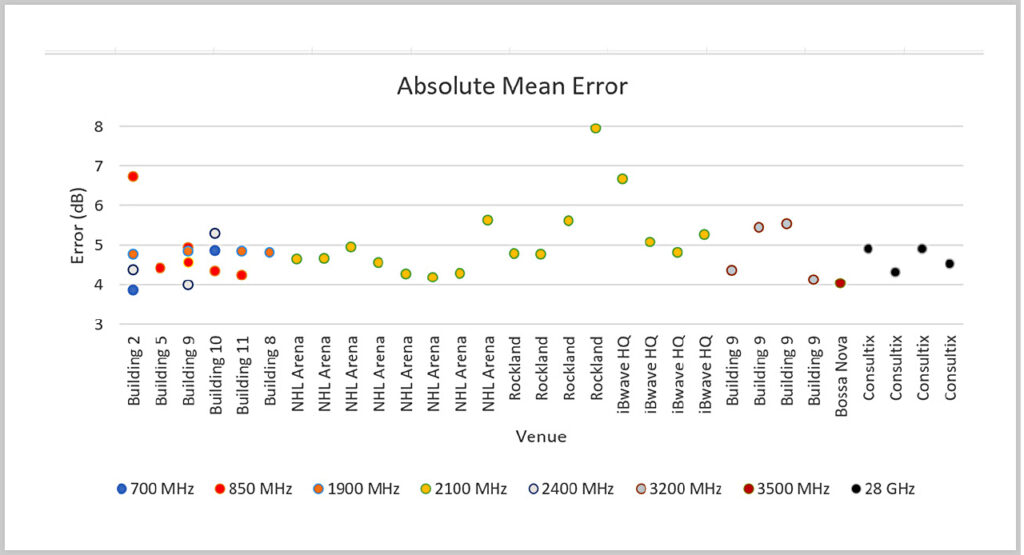
Prediction error absolute mean error for all surveys.
Most (37 out of 40) absolute mean error values are in the 4 to 6 dB range. This implies that the probability that the prediction absolute mean error is in this range is greater than 90%, regardless of the frequency.
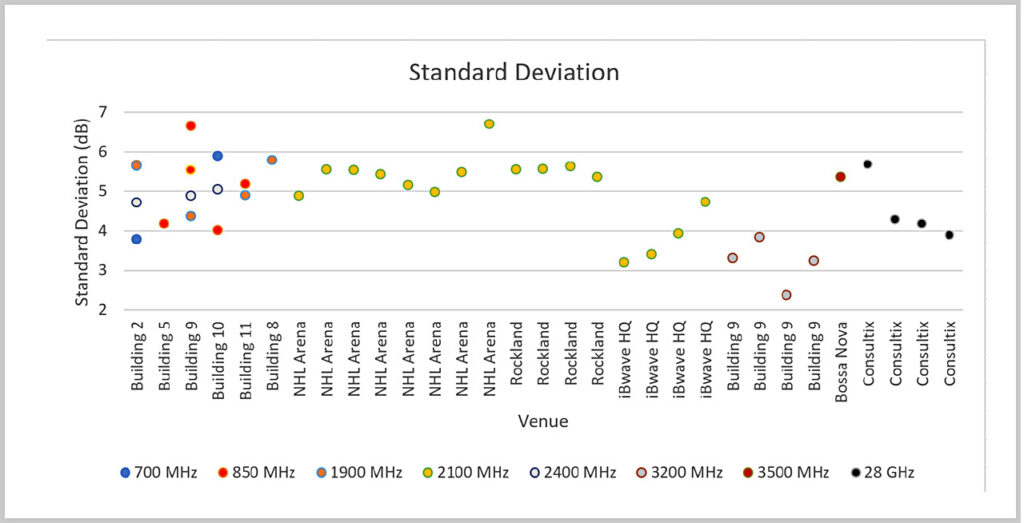
Prediction error standard deviation for all surveys.
Most (37 out of 40) standard deviation values are in the 3-6 dB range. This implies that the probability that the prediction standard deviation is in this range is greater than 90%, regardless of the frequency.
The data presented in this chapter suggests that the default (uncalibrated) FRT prediction algorithm has consistent accuracy across all frequencies and venues, from 700 MHz to 28 GHz. The probability that both the absolute mean error and standard deviation are less than 6 dB is greater than 90%, regardless of the frequency.
Conclusion
We presented the results of survey campaigns carried out at 11 venues over 8 frequency bands. CW surveys at 700, 850, 1900, 2400 and 3200 MHz were conducted at 6 buildings at Tecnológico de Monterrey campus in Querétaro, Mexico. A CW survey at 2100 MHz was conducted at 3 venues in Montreal, Canada. A 5G NR survey was conducted at 3500 MHz at Bossa Nova Mall in Rio de Janeiro, Brazil, and a 28 GHz CW survey was conducted at Consultix office in New Cairo, Egypt.
The results are summarized in Figure 68 – Figure 70. There are 40 measurements represented in those figures. Sixteen were taken at 2100 MHz, Six at 850 MHz, four each at 28 GHz, 3200 MHz, and 1900 MHz, three at 2400 MHz, two at 700 MHz, and one at 3500 MHz.
In most surveys, the transmit antenna was placed on the same level as the measured data. However, there were a few exceptions at NHL arena and Rockland Center mall, where the transmit antenna and measured data were located on different levels. As those venues are mostly line-of-sight (LOS) venues, we did not observe a significant increase in error in the predicted versus measured coverage compared to cases where the transmit and receive antennas were on the same level.
Regarding FRT accuracy, the prediction mean error is mostly in the -4 to 5 dB range, while the absolute mean error is mostly in the 4 to 6 dB range. Furthermore, the standard deviation is mostly in the 3 to 6 dB range. These values represent the default, non-calibrated FRT prediction and apply to all frequencies from 700 MHz to 28 GHz. It is expected that calibration will improve accuracy by 0.5 to 2 dB. However, the exact accuracy of calibrated FRT prediction is beyond the scope of this document.
About iBwave
iBwave Solutions, the standard for converged indoor network planning, is the power behind great in-building wireless experience, enabling billions of end users and devices to connect inside a wide range of venues. As the global industry reference, our software solutions allow for smarter planning, design, and deployment of any project regardless of size, complexity, or technology. Along with innovative software, we are recognized for world-class support in 100 countries, as the industry’s most comprehensive components database and as a well-established certification program.
For more information, visit: www.ibwave.com

